




Bitcoin (BTC) holders who acquired their coins more than five years ago have cut spending to a 90-day average of 962 BTC, the lowest level since November 2024, according to CryptoQuant data. The slowdown follows three major spending peaks over the past two years, including a high of 3,860 BTC in May 2024.
At the same time, BTC analysts said that market and profitability indicators are converging in the second half of 2026, putting a new timeline of a potential Bitcoin bottom.
Bitcoin “OG” holders step back
Crypto analyst Darkfost said the current cycle has produced the highest level of spending by long-term Bitcoin holders on record. The cohort tracked in the dataset consists of investors who acquired Bitcoin more than five years ago.
Using spent transaction outputs (STXO), which track Bitcoin that has moved across the network, the analyst identified three major spending waves following strong rallies.

OG Bitcoin Holders selling pressure. Source: CryptoQuant
The 90-day moving average peaked at 3,860 BTC in May 2024, 3,200 BTC in February 2025 and 2,360 BTC in September 2025. Individual sessions were far larger, with some days recording output exceeding 10,000, 30,000 and even 142,000 BTC.
That selling pressure has eased sharply. The 90-day average has dropped to 962 BTC, the lowest reading in 19 months. Darkfost said the most expensive coins held by this group were acquired for about $63,200, which is close to current prices. This indicates that many of these holders are choosing not to sell, even though their holdings are trading near their highest cost basis.
Bitcoin Researcher Axel Adler Jr. further noted a split between newer and older BTC investors. The analyst said that Bitcoin’s adjusted net unrealized profit/loss (aNUPL) has fallen to -0.14 from near zero a month ago, showing that the average holder has moved back into unrealized losses as BTC traded near $62,500. However, Adler Jr argued,
“STH capital has shrunk by -56%, while LTH capital has barely drawn down. Weak hands are capitulating. Strong hands have not even flinched.”
Adler Jr. added that the key metric has spent nearly half of the past three months below zero, indicating sustained pressure on newer BTC market participants rather than a broad capitulation across long-term holders.
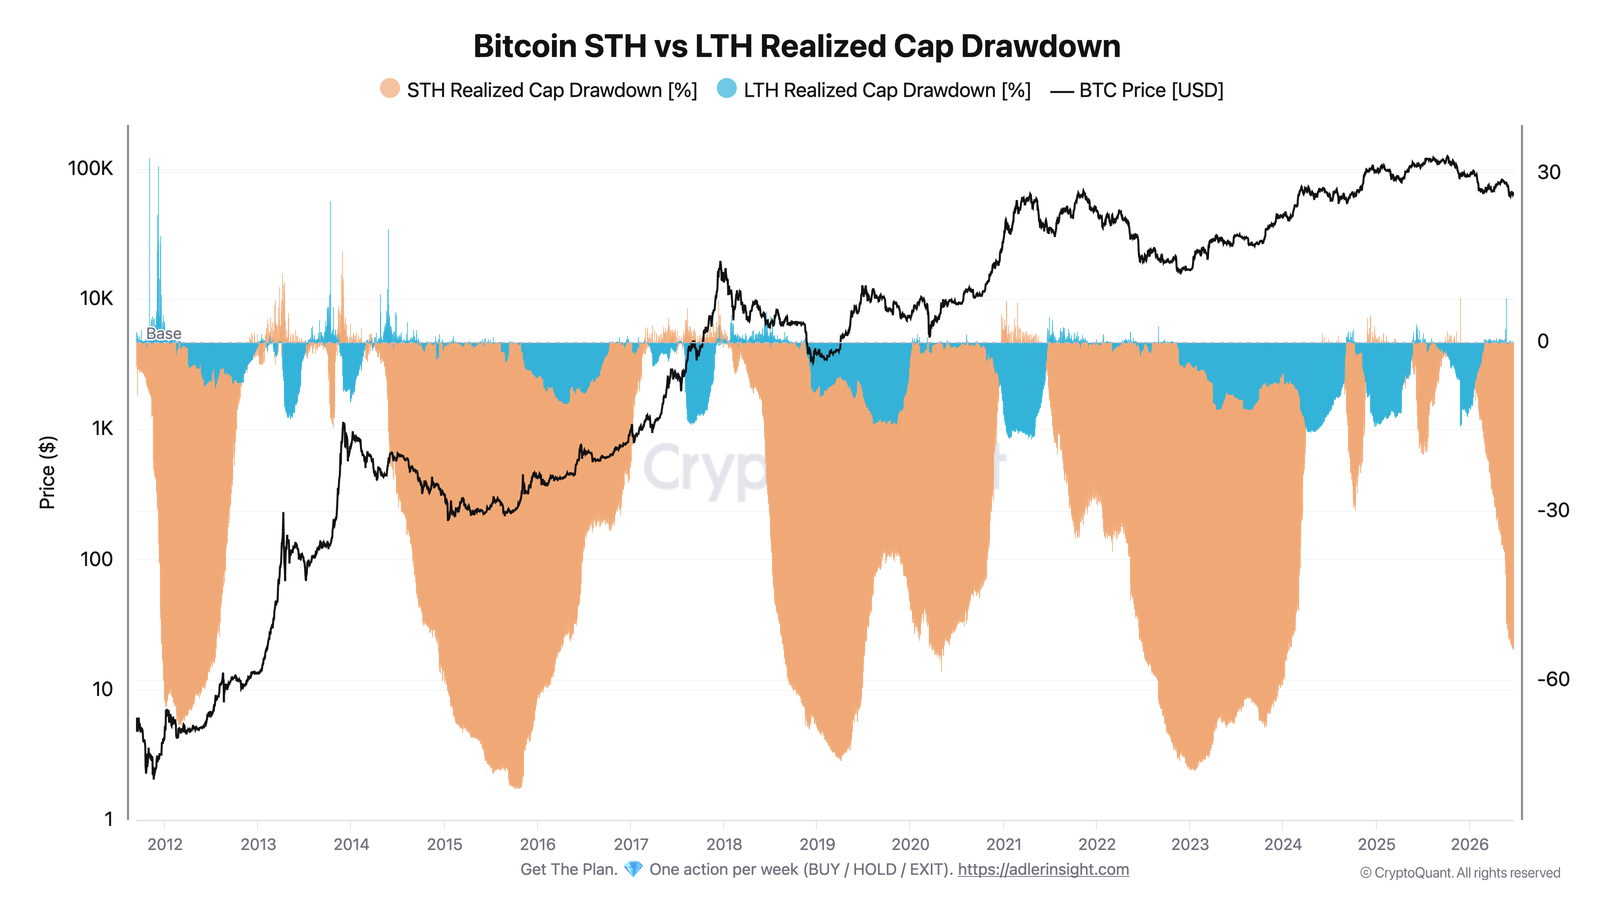
STH vs LTH realized cap analysis. Source: Axel Adler Jr.
Related: Bitcoin slump worsens amid SpaceX rout: Can BTC price hold $60K any longer?
BTC halving cycle points to September bottom, says analyst
Crypto analyst LP highlighted a recurring pattern tied to Bitcoin’s halving cycles. The previous bear market entered a final capitulation phase 826 days after the halving event, followed by a major low and sideways consolidation for 70 to 110 days.
For the current cycle, the 826-day marker falls on July 6. Applying the same timing range places a potential bottoming window in early September.
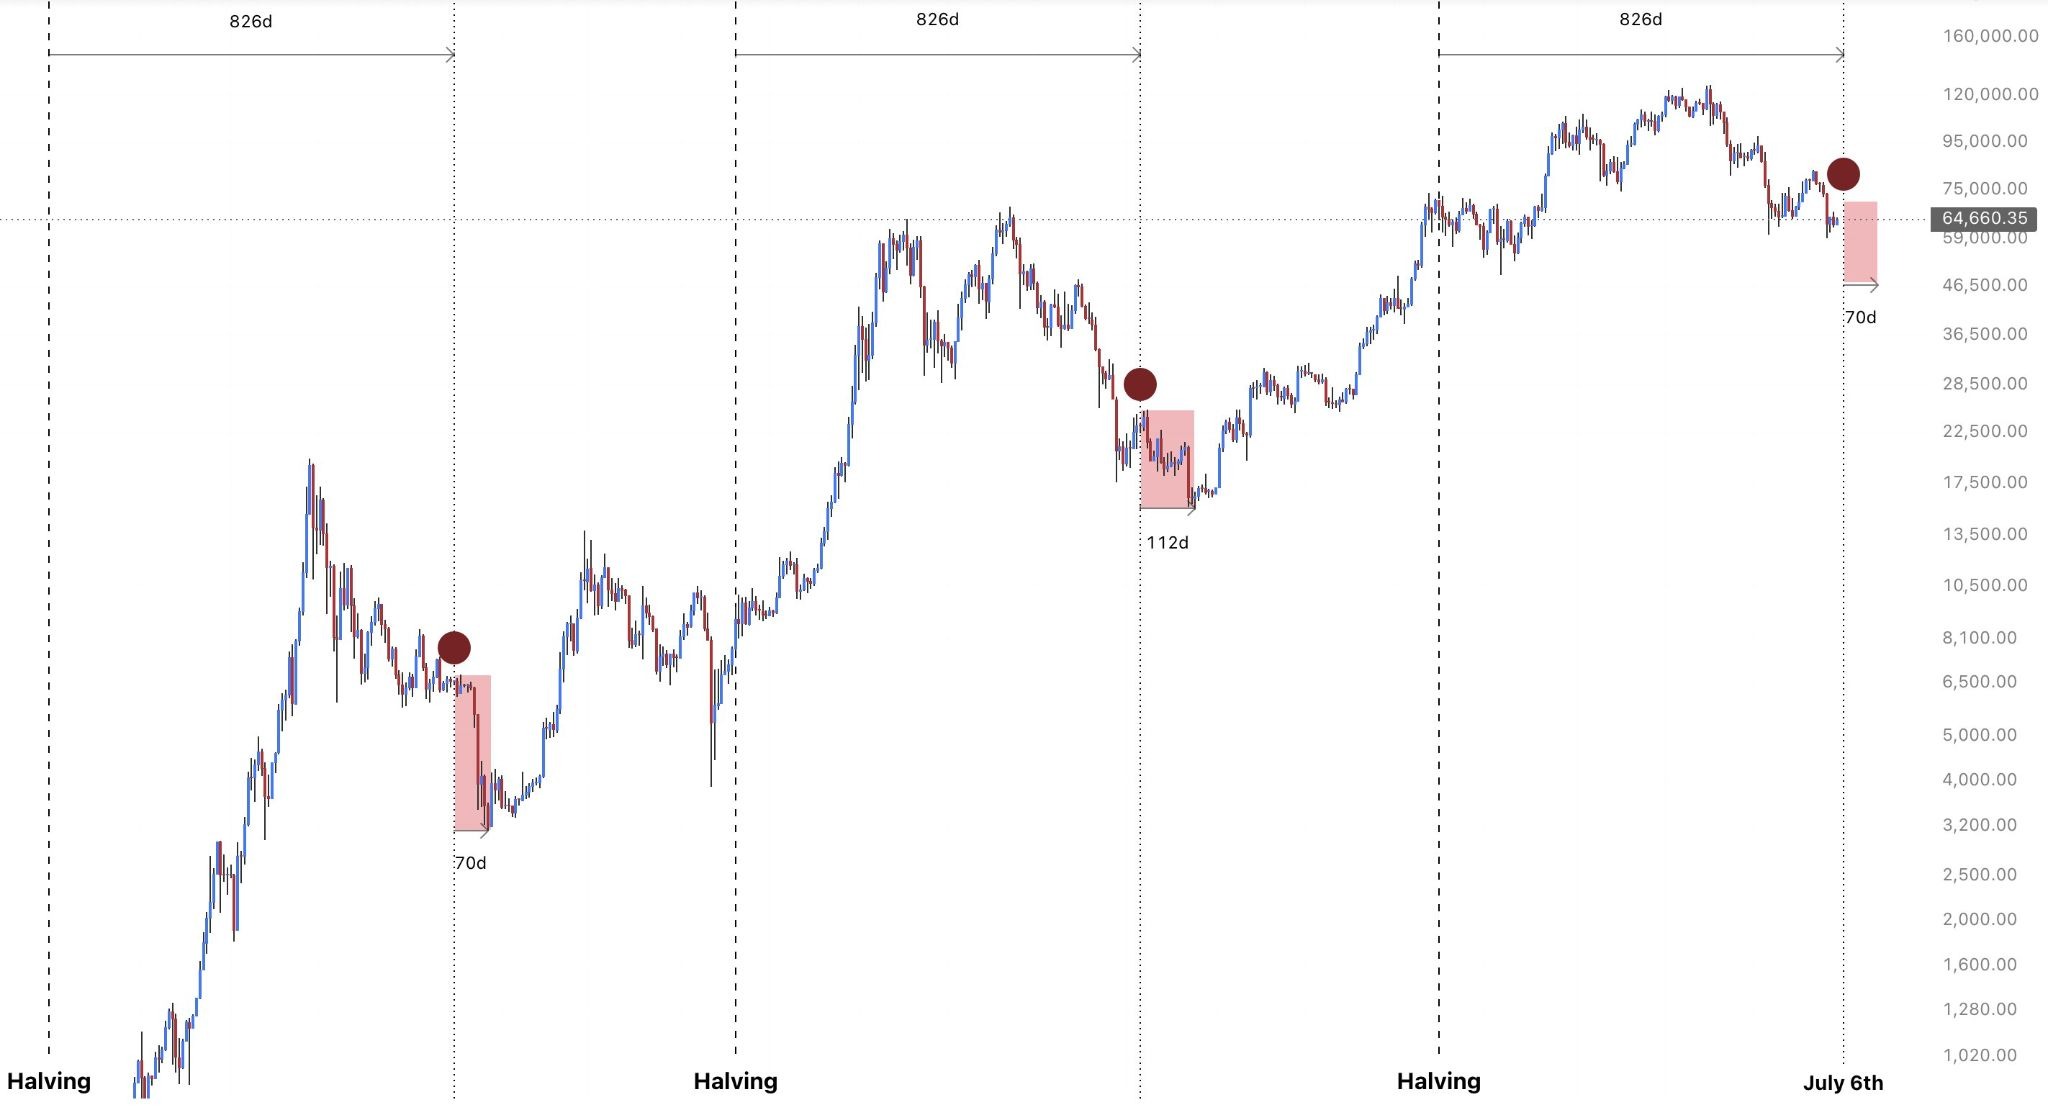
BTC bottom analysis by LP. Source: X
The trader noted that the scenario becomes more relevant if Bitcoin continues to trade higher into early July.
Likewise, BTC trader Titan also identified downside liquidity below the current levels. On the quarterly chart, Bitcoin has an untapped low near $58,900 and an open fair value gap between roughly $49,000 and $58,900.
The trader explained that leaving the quarterly low untouched throughout September may draw more attention to that liquidity zone, eventually leading to a market bottom between Q3 and Q4.
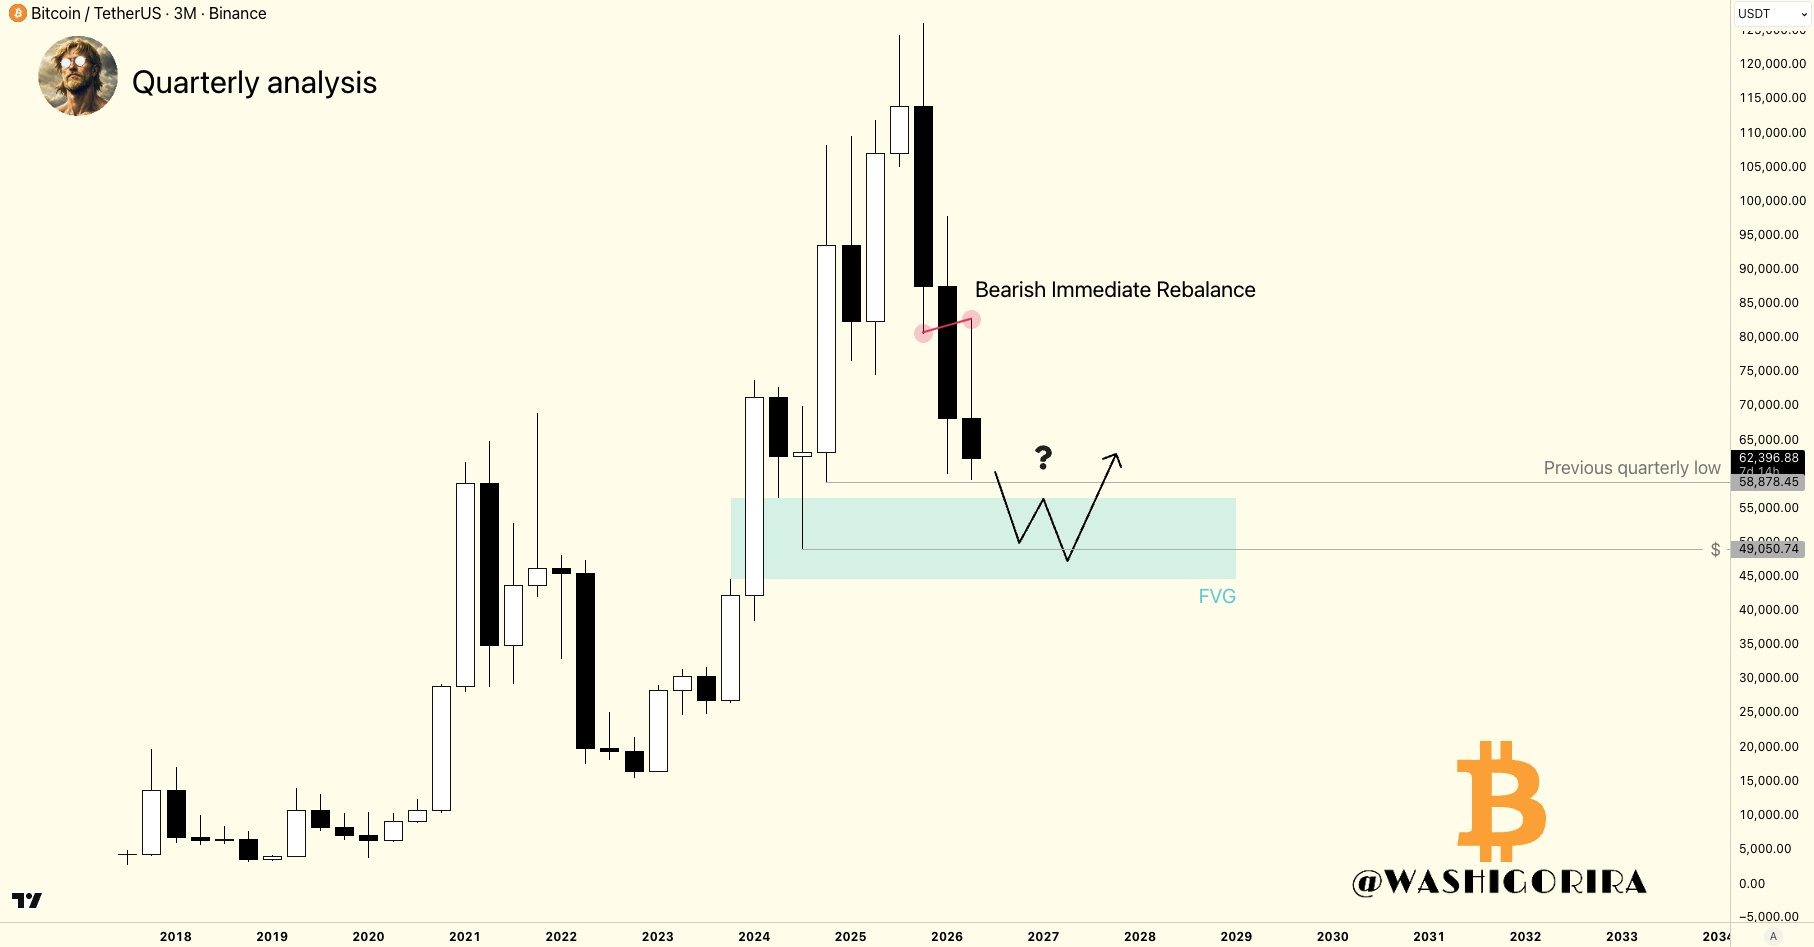
BTC quarterly analysis. Source: X
Related: Bitcoin gets new $54K warning as BTC price hits 11-day low on Asia tech sell-off