




Bitcoin (BTC) chart technicals suggest that the BTC price rebound to $100,000 may still happen by September.
BTC/USD daily chart. Source: TradingView
Key takeaways:
- Bitcoin is painting a potential double-bottom and bullish divergence pattern.
- BTC price must break above a resistance confluence near $66,700
Double-bottom hints at 60% BTC price upside
BTC rebounded 13.25% from its local low below $60,000, as a preliminary truce between the US and Iran revived risk appetite across global markets.

The recovery pushed BTC back toward $67,000 on June 15, tracking a broader relief rally in risk assets after the geopolitical breakthrough pressured oil prices lower and reduced near-term inflation fears.
Now, the three-day Bitcoin chart is flashing a potential double-bottom reversal near the $60,000 support zone.
BTC has rebounded from the $60,000 area for the second time in 2026, strengthening the case that buyers are defending the same demand region that previously supported the market during earlier corrections.
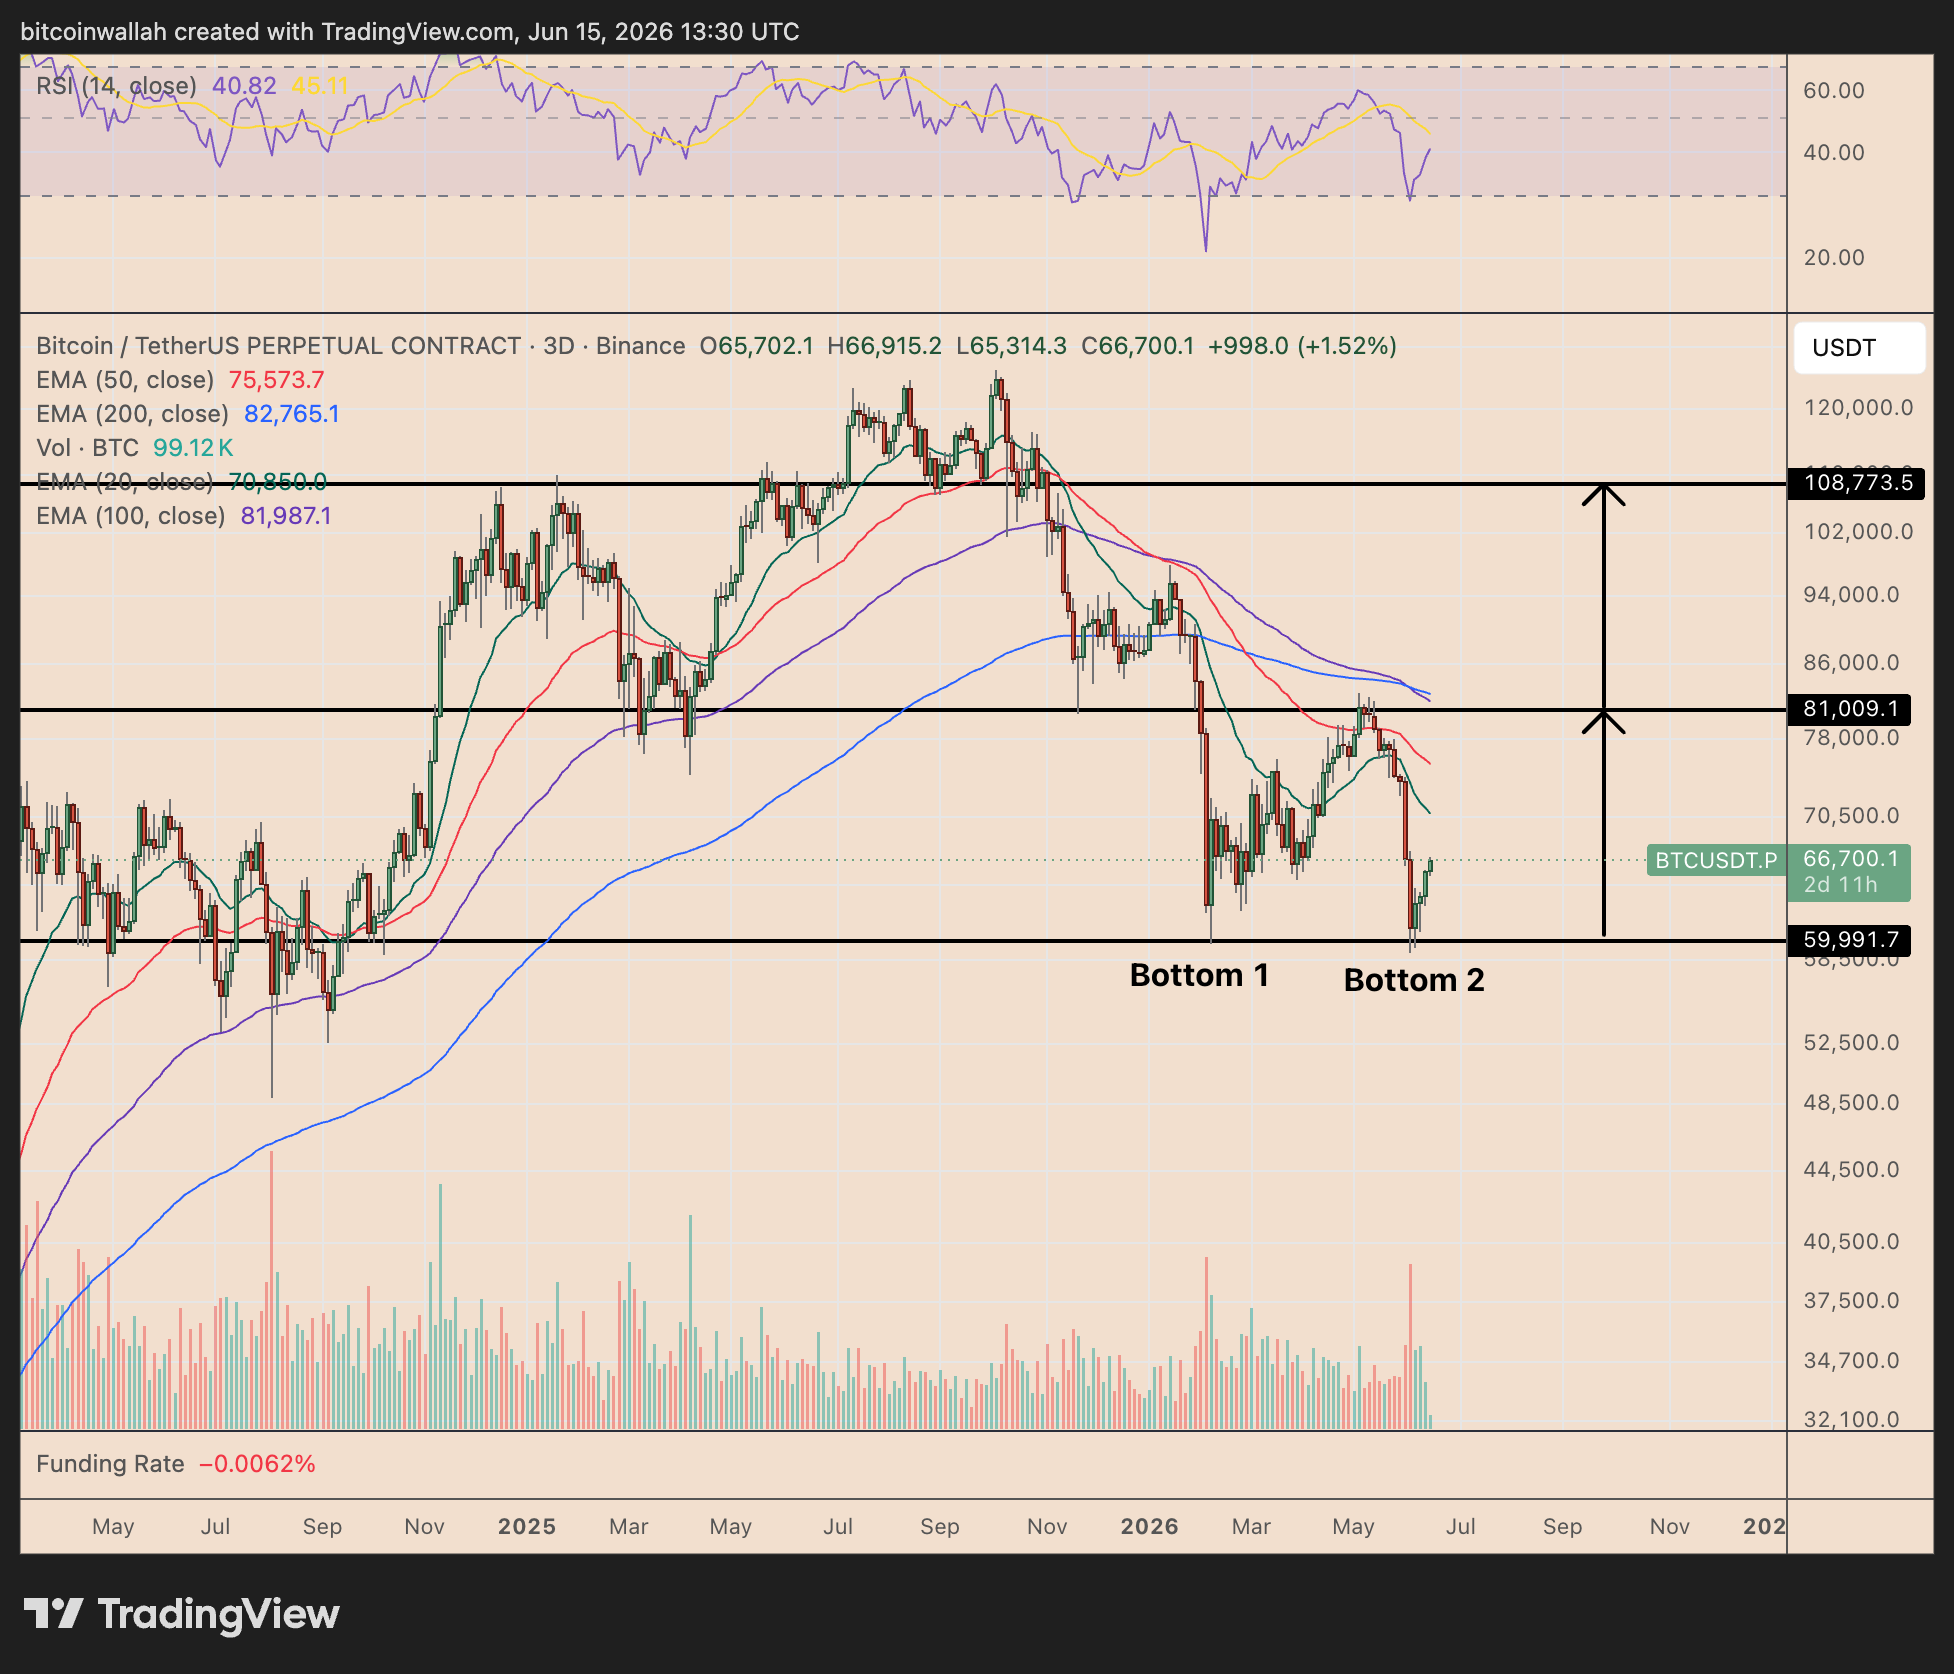
BTC/USDT three-day price chart. Source: TradingView
The first bottom formed near the March low, while the latest rebound came after a sharp June sell-off that briefly pushed Bitcoin back toward the same level. As long as BTC holds above the $60,000 support, the double-bottom structure remains active.
The setup’s neckline sits near $81,000, where Bitcoin previously stalled before the latest leg down.
A decisive close above that level would confirm the double-bottom pattern and open the door to a measured move toward $108,000 by August or September, or over 60% from current price levels.
Bitcoin weekly RSI divergence strengthens $100,000 setup
Bitcoin’s weekly chart is showing a bullish divergence between price and the relative strength index (RSI) momentum indicator.
BTC recently made a lower low near the $60,000–$65,000 support zone, but its weekly RSI formed a higher low. That shows sellers pushed the price lower, albeit with less momentum.
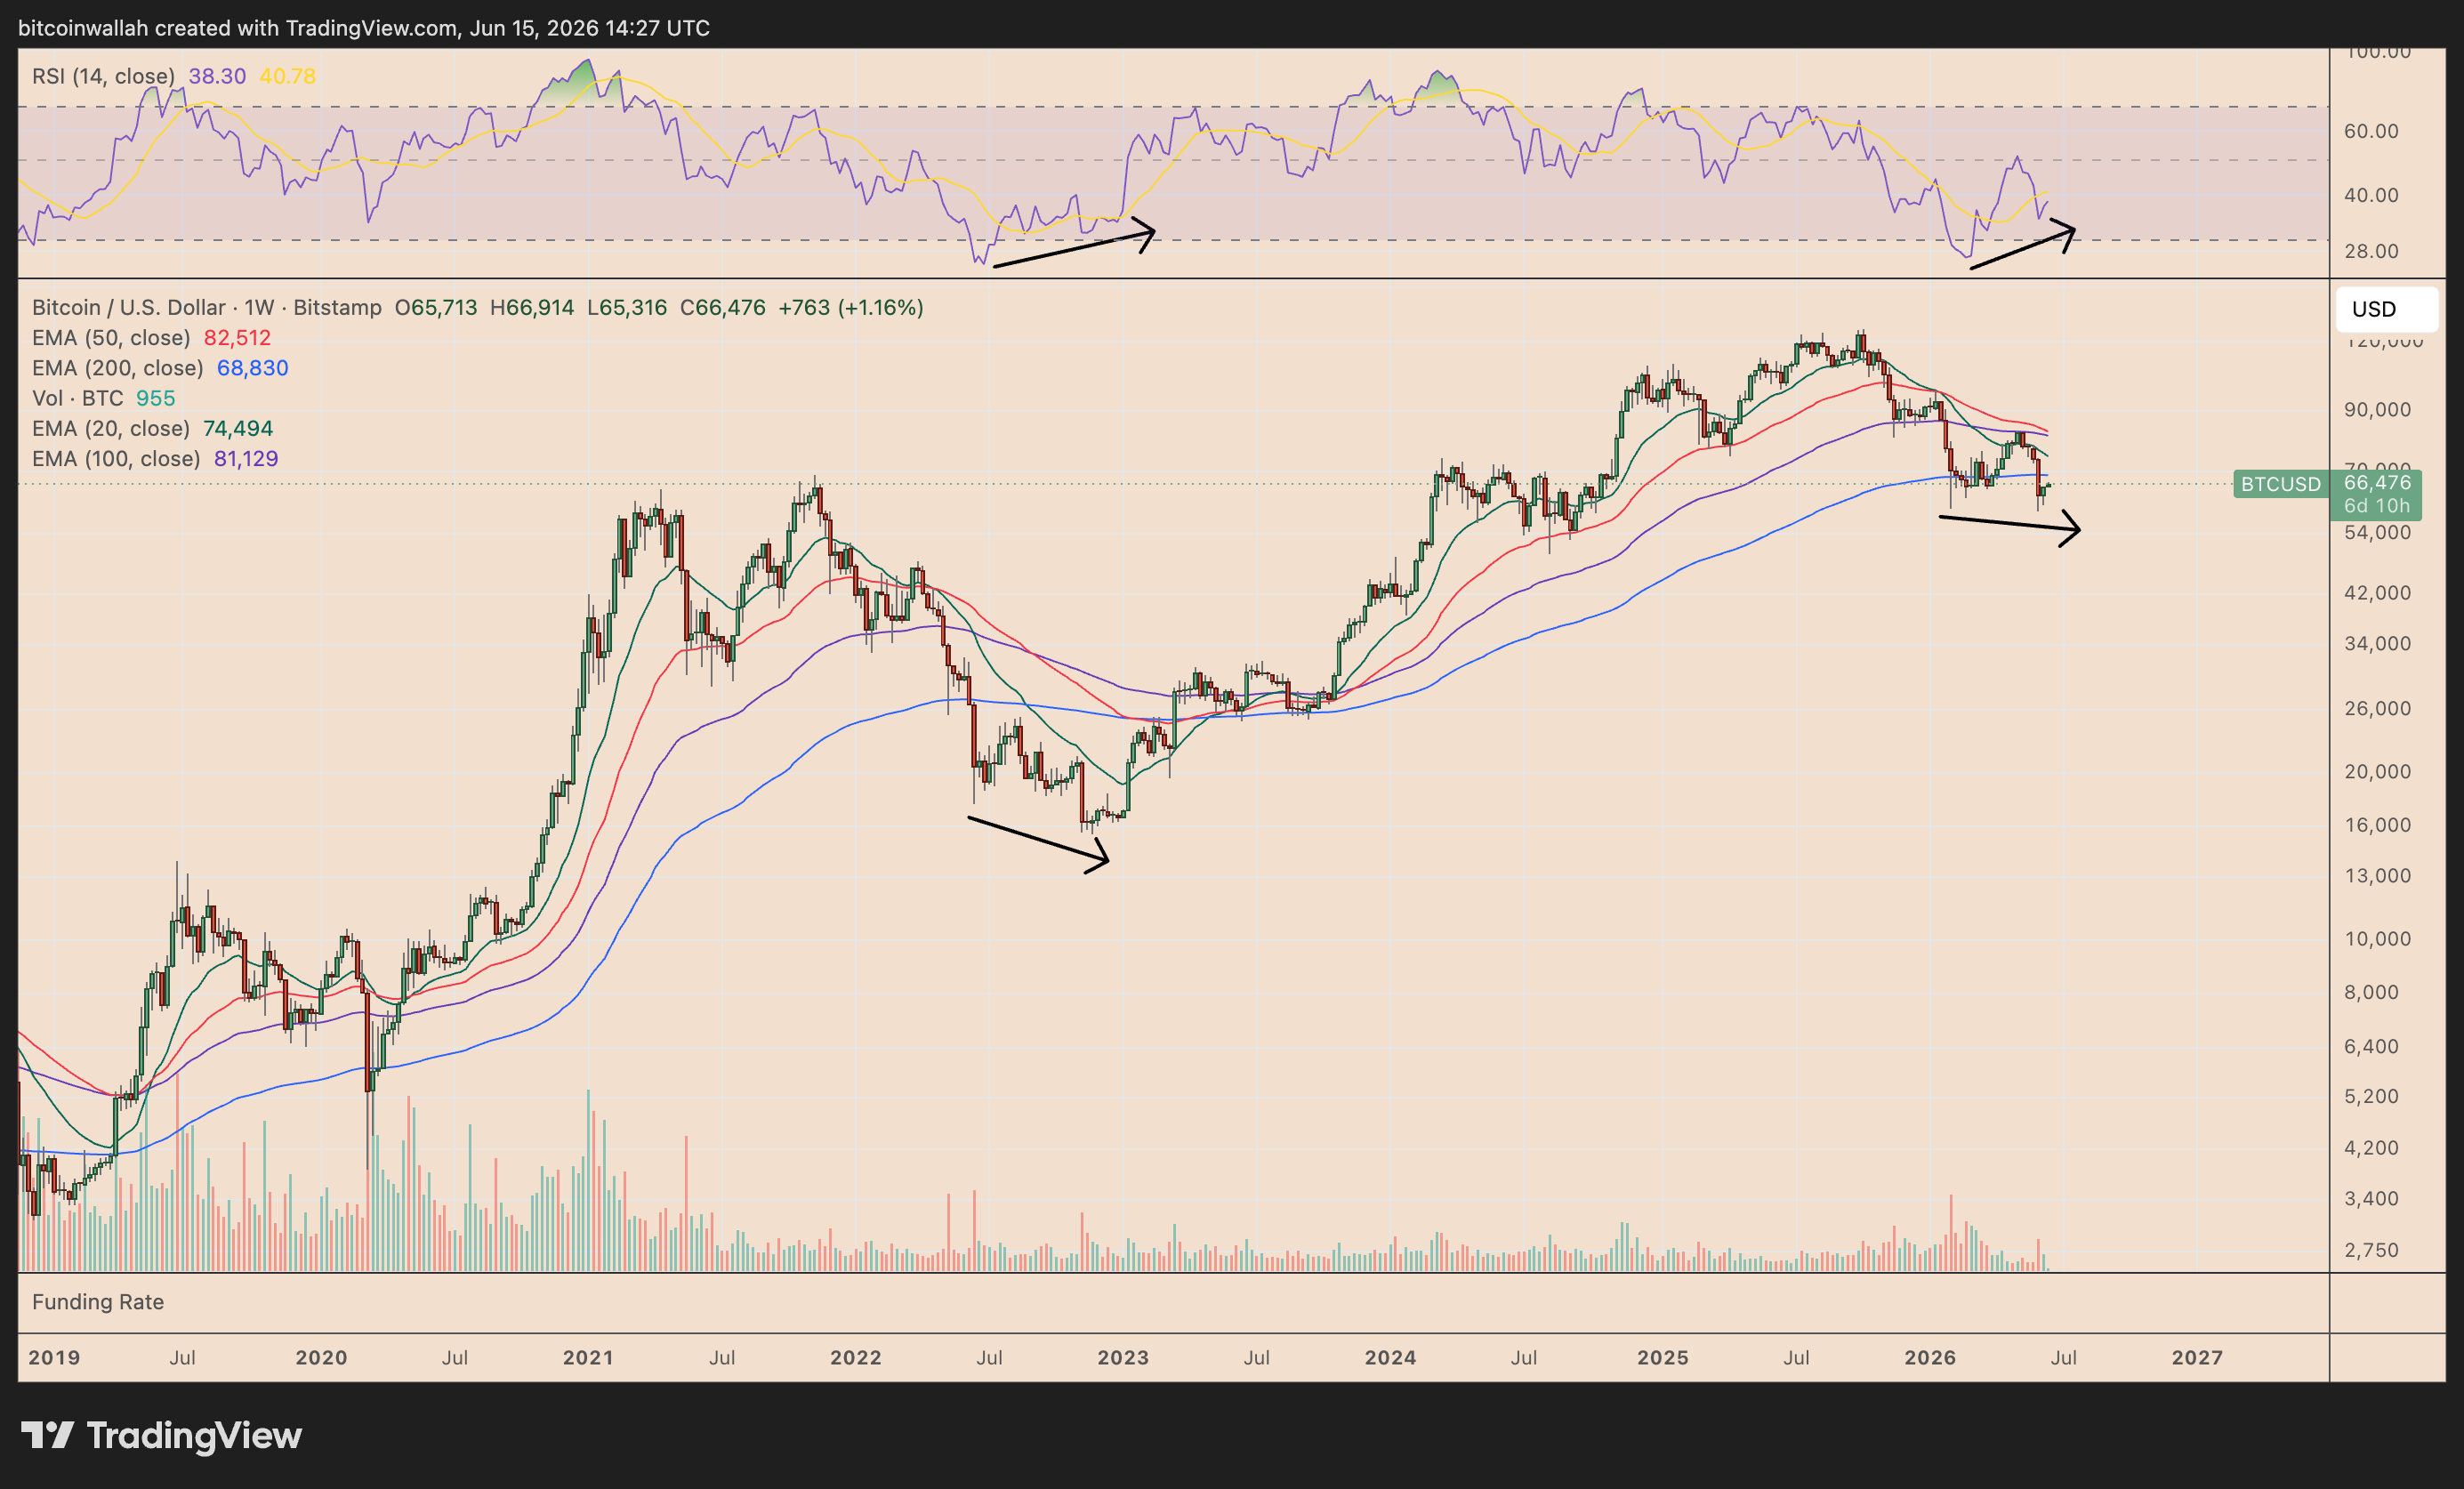
BTC/USD weekly chart. Source: TradingView
A similar divergence appeared near Bitcoin’s 2022 bear-market bottom, when RSI recovered before price followed with a multi-month rebound.
In a Monday post, analyst Jelle said Bitcoin may act “similarly to late 2022 in the coming months.”
The current setup now strengthens Bitcoin’s double-bottom case near $60,000. BTC still needs confirmation, with the first big resistance levels near the 20-week EMA at $74,500 and the 50-week EMA around $82,500.
Reclaiming those levels would increase the probability of a summer recovery toward $100,000. While a weekly close below $60,000 would weaken the bullish setup.
Bitcoin bear flag remains a risk
Bitcoin’s short-term chart still leaves room for another downside move before the broader bullish reversal setup confirms.
BTC is testing a resistance confluence formed by the bear flag’s upper trend line and the 20-day EMA (green) near $66,700.
Related: Bitcoin analysis warns over BTC price rejection as $67K approaches
A rejection from this zone could send the price back toward the flag’s lower trend line near $63,600, keeping Bitcoin trapped inside its bearish continuation structure.
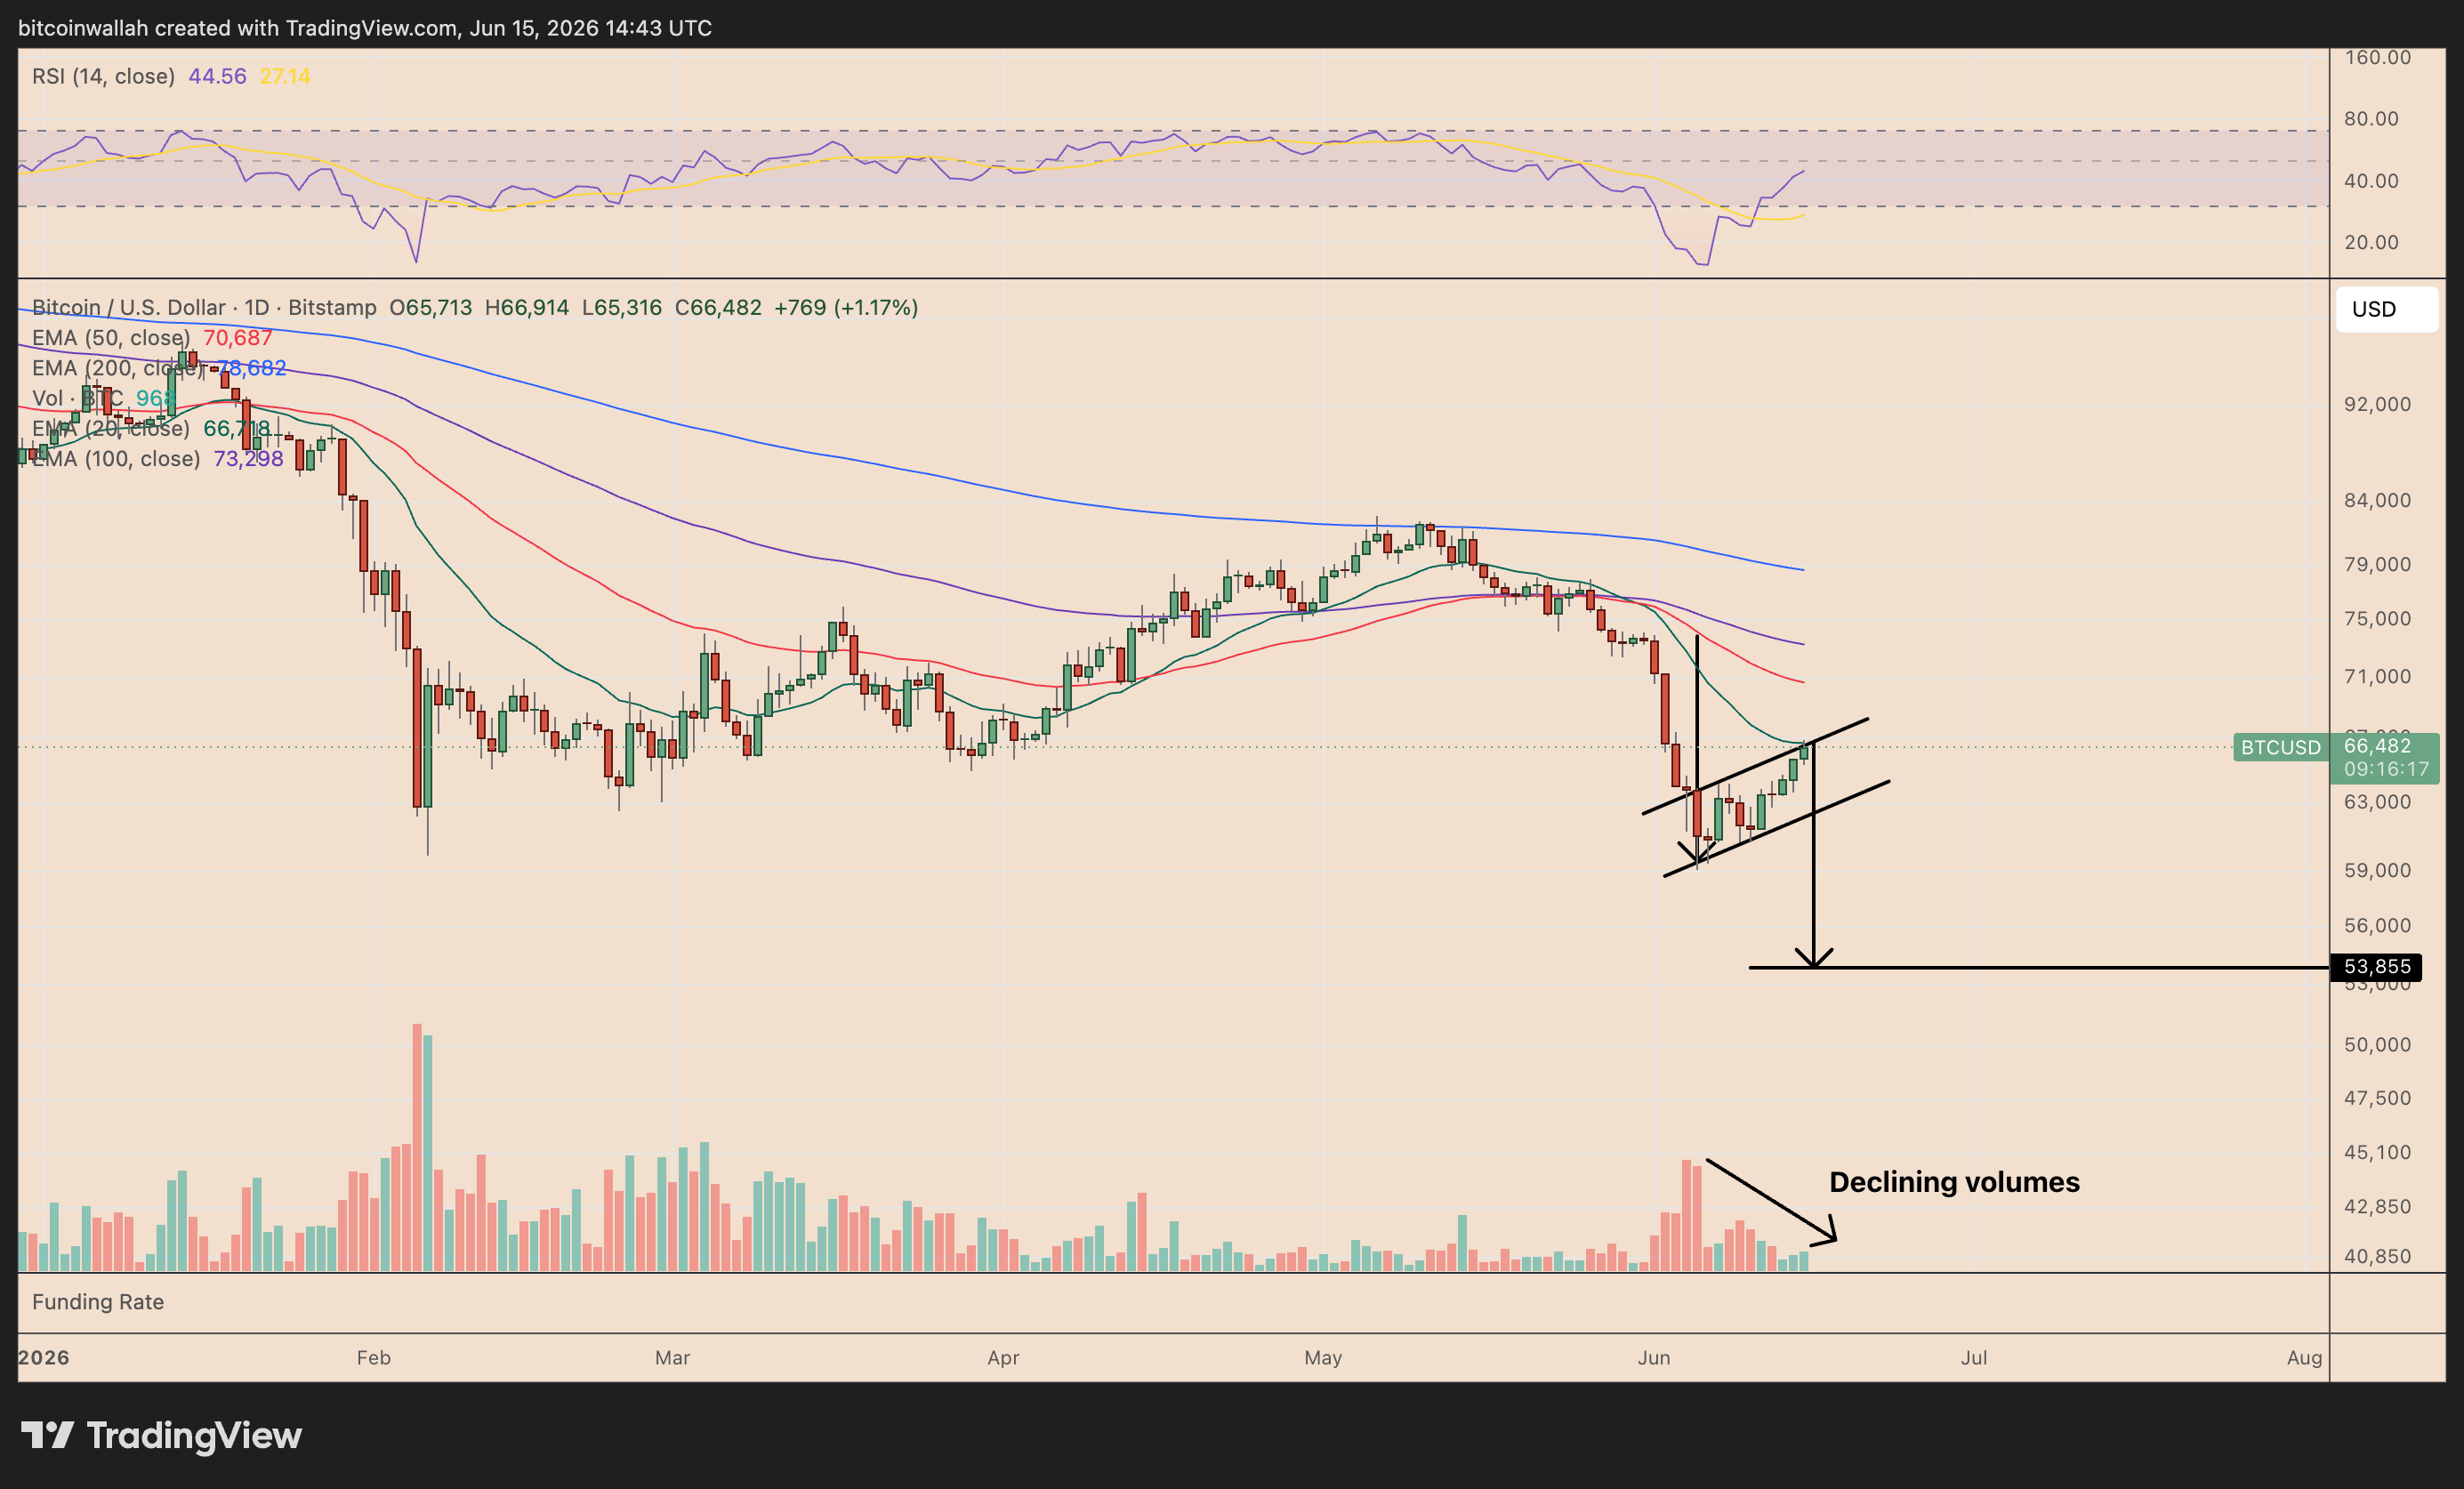
BTC/USD daily price chart. Source: TradingView
A decisive daily close below that lower trend line would confirm the bear flag breakdown. Based on the height of the previous sell-off, the measured downside target is $53,850, or about 20% below current prices.
Declining volume during the flag’s formation increases the chances of this scenario, as weak participation often signals that the rebound is corrective rather than impulsive.
Bitcoin whale inflows add downside pressure
The bearish short-term setup also aligns with elevated selling from Bitcoin whales.
CryptoQuant analyst Darkfrost noted that whale inflows to Binance rose sharply after BTC’s latest correction. Large holders sent an average of 3,200 BTC per day to the exchange over the past month, up from 1,200 BTC at the end of April.
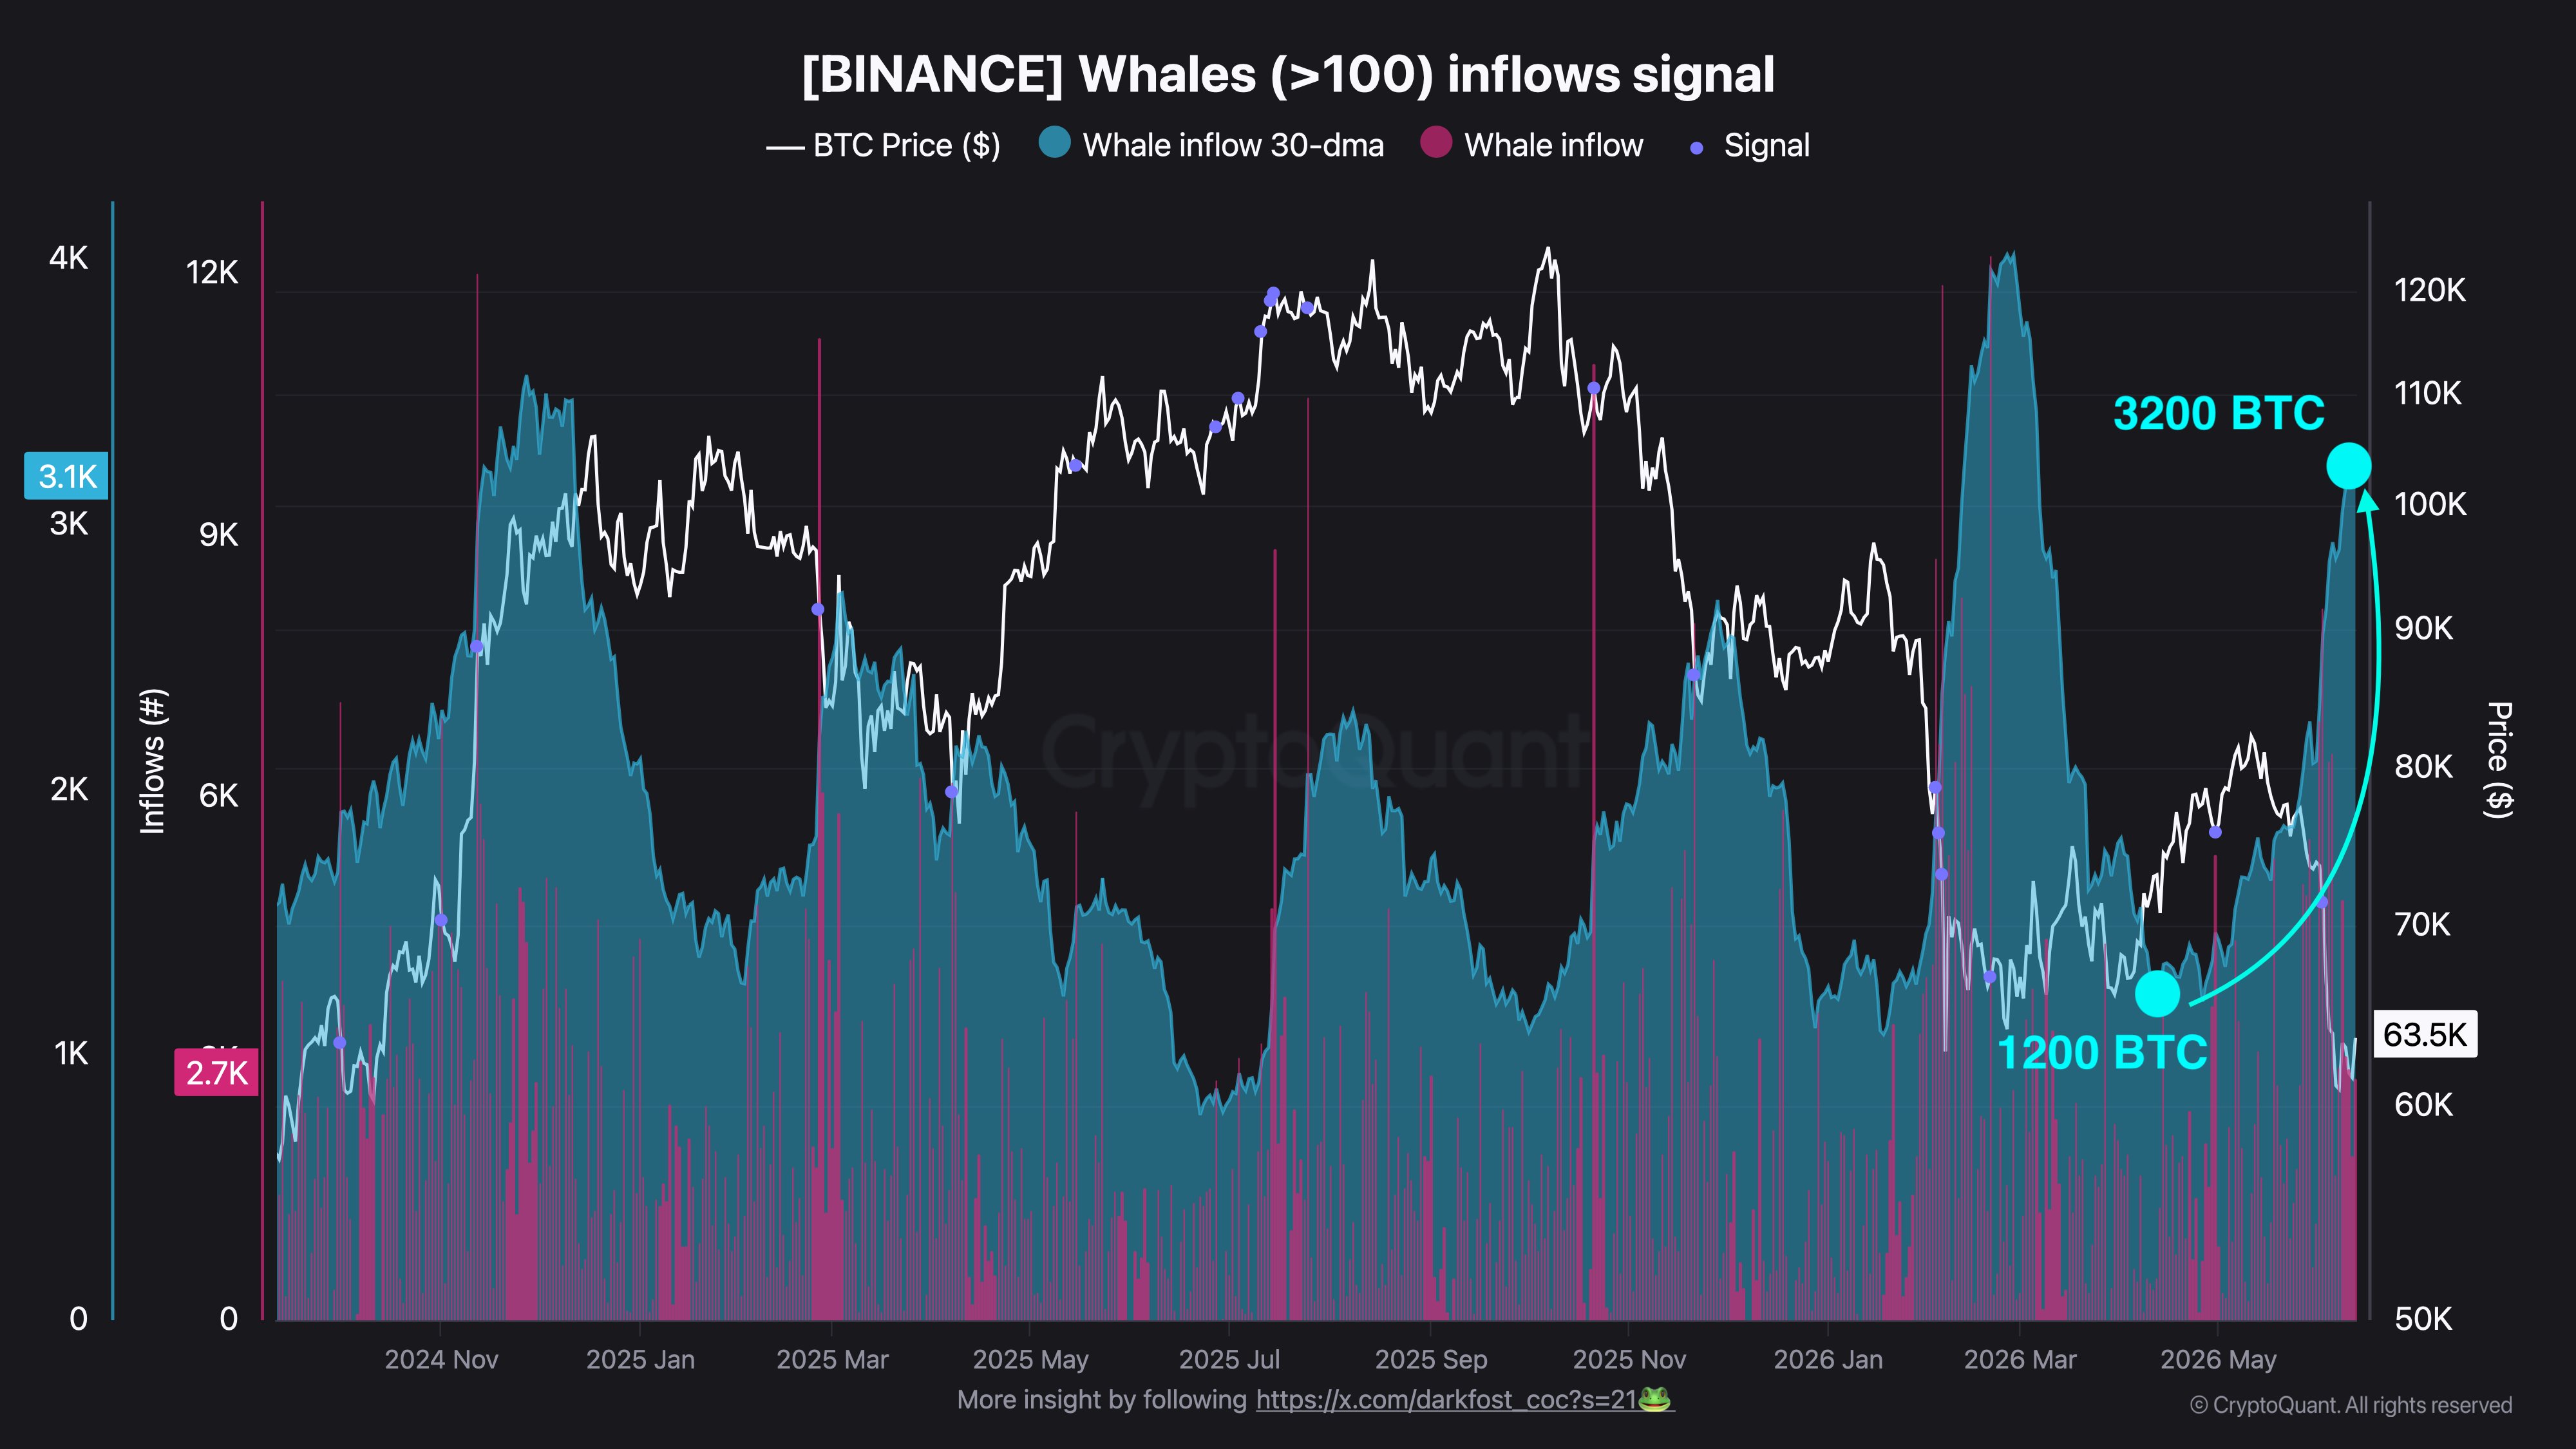
Binance inflows by whales holding over 100,000 BTC. Source: CryptoQuant/Darkfrost
“This trend suggests that many large holders increased their selling activity, or at least their willingness to sell, during the recent downturn,” he wrote in a Monday note.