



Bitcoin (BTC) recent buyers are the latest hurdle to a breakout from a stubborn trading range in place since June.
Key points:
Bitcoin short-term holders seeking breakeven exit
In the latest edition of its weekly newsletter, crypto analytics platform Glassnode highlighted the ongoing significance of Bitcoin’s speculative investor base.
Short-term holders (STHs) — those holding BTC acquired within the past six months — are currently around 7.2% underwater on their investment in aggregate. The cohort’s cost basis, also known as realized price, which Glassnode calculates at $68,700, thus forms a key resistance level to clear.

“The cost-basis ladder frames the stalemate. Spot sits just above the Median Realized Price at $63.0K, the level that splits every coin’s cost basis down the middle, and below the Short-Term Holder Cost Basis at $68.7K, the average entry of the market’s most recent buyers,” it wrote.
“That cohort is underwater, which historically makes it quick to sell into recoveries, while the median level has absorbed every test from above for more than a month.”
Bitcoin realized price data. Source: Glassnode
BTC/USD has been wedged in a narrow range between $58,000 and $68,000 since the start of June. As Cointelegraph reported, a separate battle between buyers and sellers continues within that range, with a 50-month trend line near $65,800 now keeping price even more constricted. Analysis sees this as a classic phenomenon during Bitcoin bear markets, with a downside resolution increasingly likely.
This week, trader and analyst Rekt Capital additionally warned that $63,000 was weakening as local support, with price gaining progressively less ground with each rebound from that level.
BTC supply dynamics add weight to current spot range
Bitfinex Alpha, the research arm of crypto exchange Bitfinex, noted that a significant portion of the BTC supply has moved onchain during the range-bound period.
Related: Bitcoin miners earn under 0.7% of revenue from fees in new 10-year low
“The reason the boundaries are so stubborn is due to ownership. The $62,000-$65,000 band holds 1,794,308 BTC at this cost basis, 8.93% of circulating supply per the UTXO Realised Price Distribution (URPD), with the largest holdings at ~$63,800,” it reported on Wednesday.
URPD records the price at which coins last moved onchain, with the 1.79 million BTC tranche equal to approximately 8.9% of the total circulating supply.
“With price trading inside this band, the largest concentration of holders across any narrow $3,000 range keeps moving between profit and loss and a large volume of coins changes hands as a result,” Bitfinex added.
Immediately above the current STH cost basis lies another psychologically significant level — Bitcoin’s old all-time high of $69,400 from November 2021.
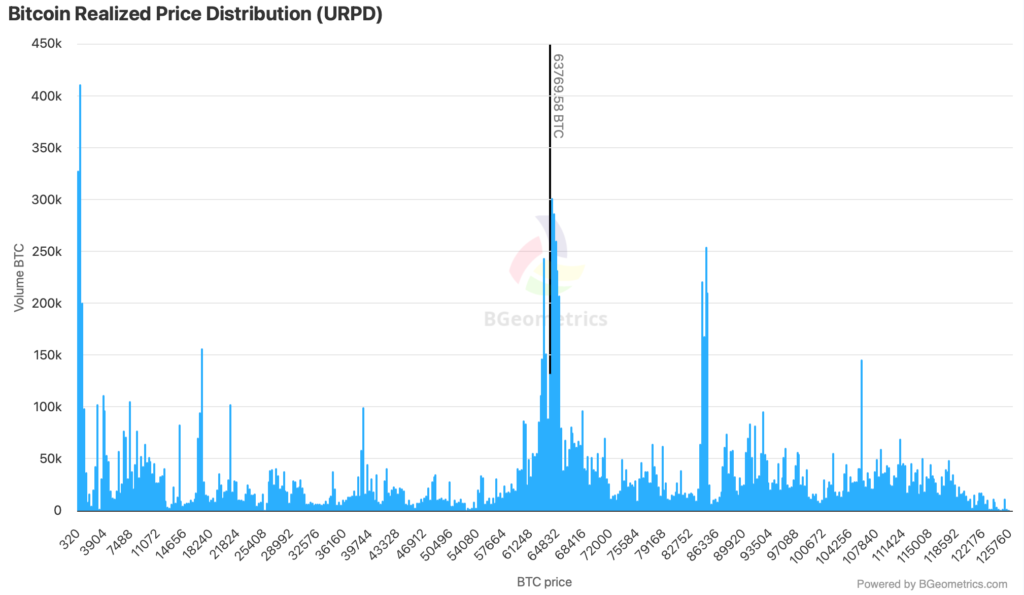
Bitcoin URPD chart. Source: Bitfinex Alpha