




Bitcoin (BTC) is heading for its worst weekly performance since November 2022, down around 15% week-to-date as of Friday.
BTC/USD weekly chart Source: TradingView
BTC was trading near $62,500 after briefly dropping toward $61,000 earlier in the session. The roughly $1,500 rebound showed bulls are still trying to defend the psychologically important $60,000 support level.
How low can Bitcoin go if it breaks below $60,000?
Key takeaways:
- Bitcoin is testing its 200-week SMA near $61,800, a level that has historically acted as major cycle support.
- Analyst says $55,000 may be Bitcoin’s worst-case downside if the 200-week SMA continues to hold.
Bitcoin to $55,000 is the worst-case scenario: Analyst
Bitcoin may print a brief wick below $60,000 before finding stronger demand, according to analyst Radz.
In a Friday post, he said $55,000 could mark the “worst” downside scenario for Bitcoin, citing the 200-week simple moving average (200-day SMA, pink) as the core reason behind his bullish outlook.
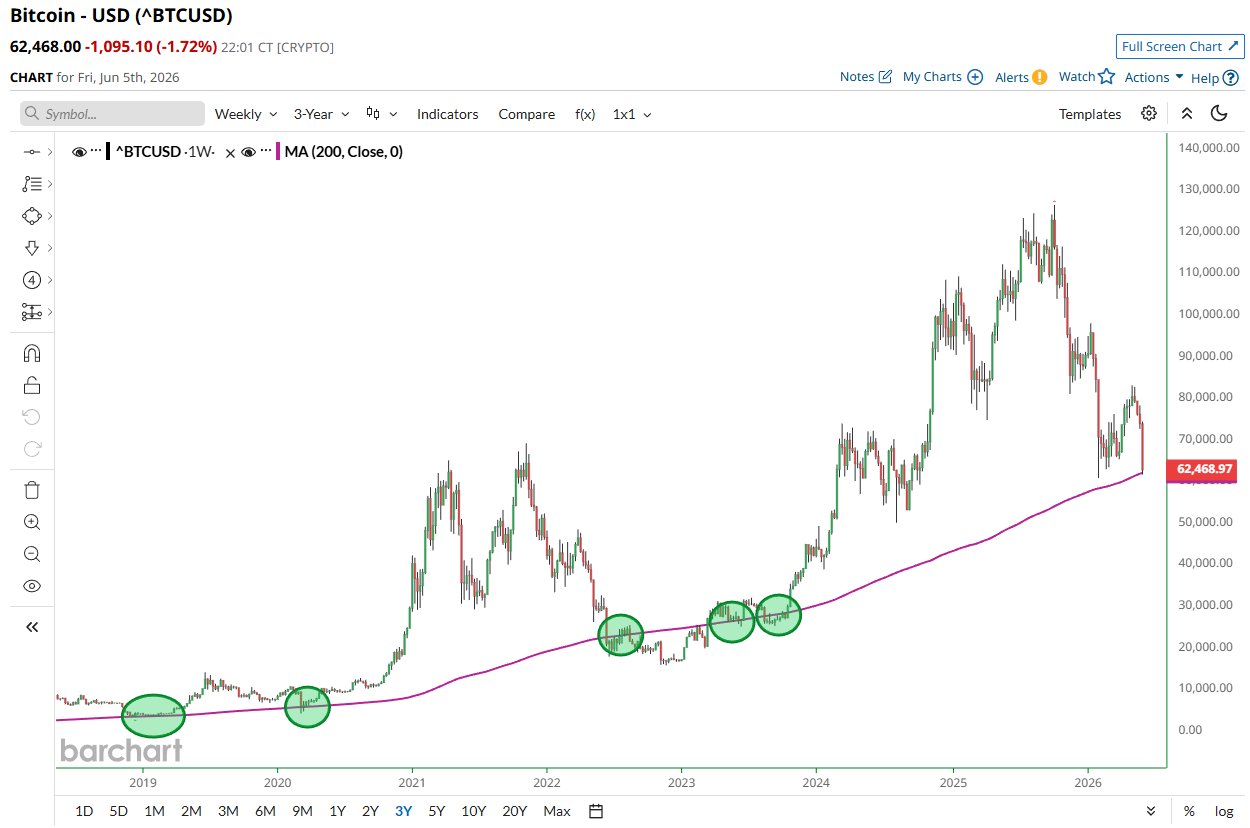
BTC/USD weekly chart. Source: BarChart/TradingView
That level has historically acted as one of Bitcoin’s strongest long-term support zones. Previous retests of the 200-week moving average in 2019, 2020, 2022 and 2023 either marked major cycle lows that preceded strong recovery phases.
In February 2026, Bitcoin rose by over 37% after testing the 200-week SMA as support too. This week is BTC’s second attempt this year to hold above the pink line, as it treads around $62,000.
Bitcoin bear flag warns of deeper correction toward $50,000
A maturing bear flag on Bitcoin’s chart suggests the correction may extend well below the $55,000 area.
As of Friday, BTC had broken below the flag’s lower trend line, with rising trading volume showing stronger conviction behind the move. In technical analysis, a bear flag forms when the price consolidates higher inside a narrow channel after a sharp decline, before resuming the prior downtrend.
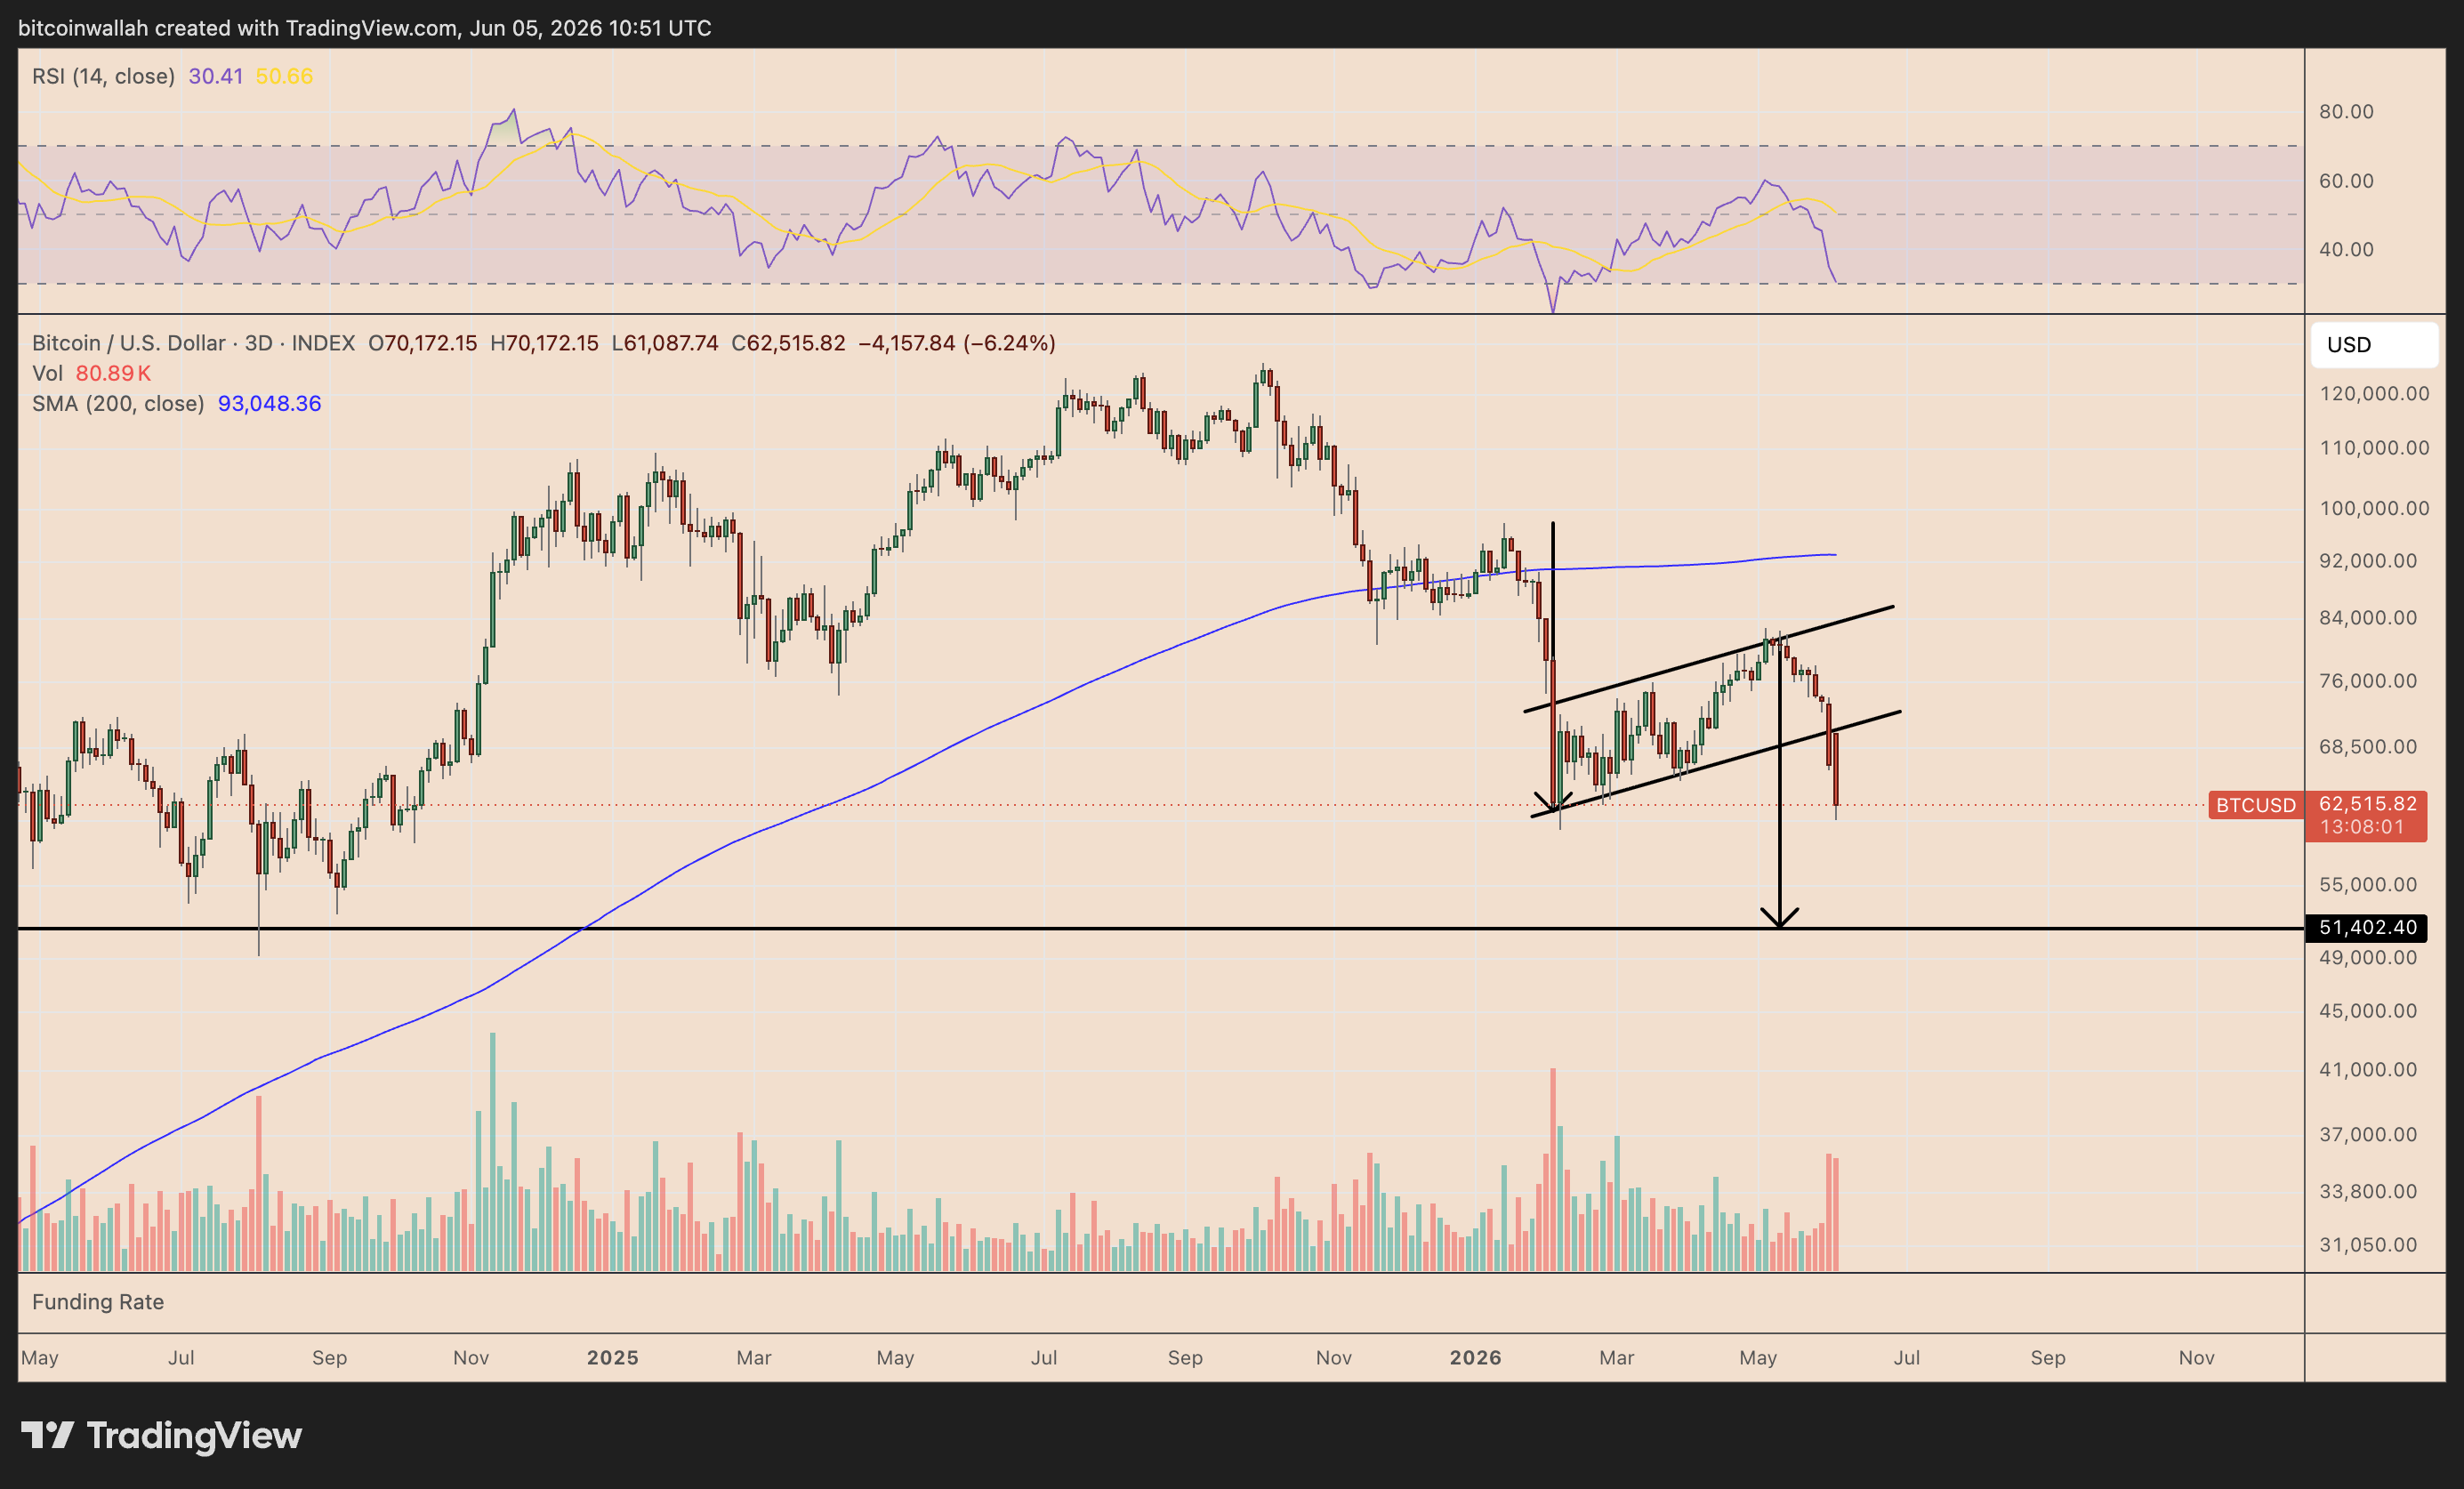
The measured target is calculated by subtracting the height of the preceding decline from the breakdown point. In Bitcoin’s case, that projects a downside target near the $50,000–$51,000 support zone.
That area also aligns with previous horizontal support, making it the next major level to watch if BTC fails to reclaim the flag’s lower trend line over the next few days.
Bitcoin onchain data points to $50,000–$54,000 target
Bitcoin’s onchain data points to a similar target as the bear flag setup.
Glassnode’s MVRV pricing bands show BTC’s realized price (purple) near $53,740. In simple terms, realized price is the average price at which the Bitcoin supply last moved onchain. In the past, this level acted like a major support level during correction cycles.
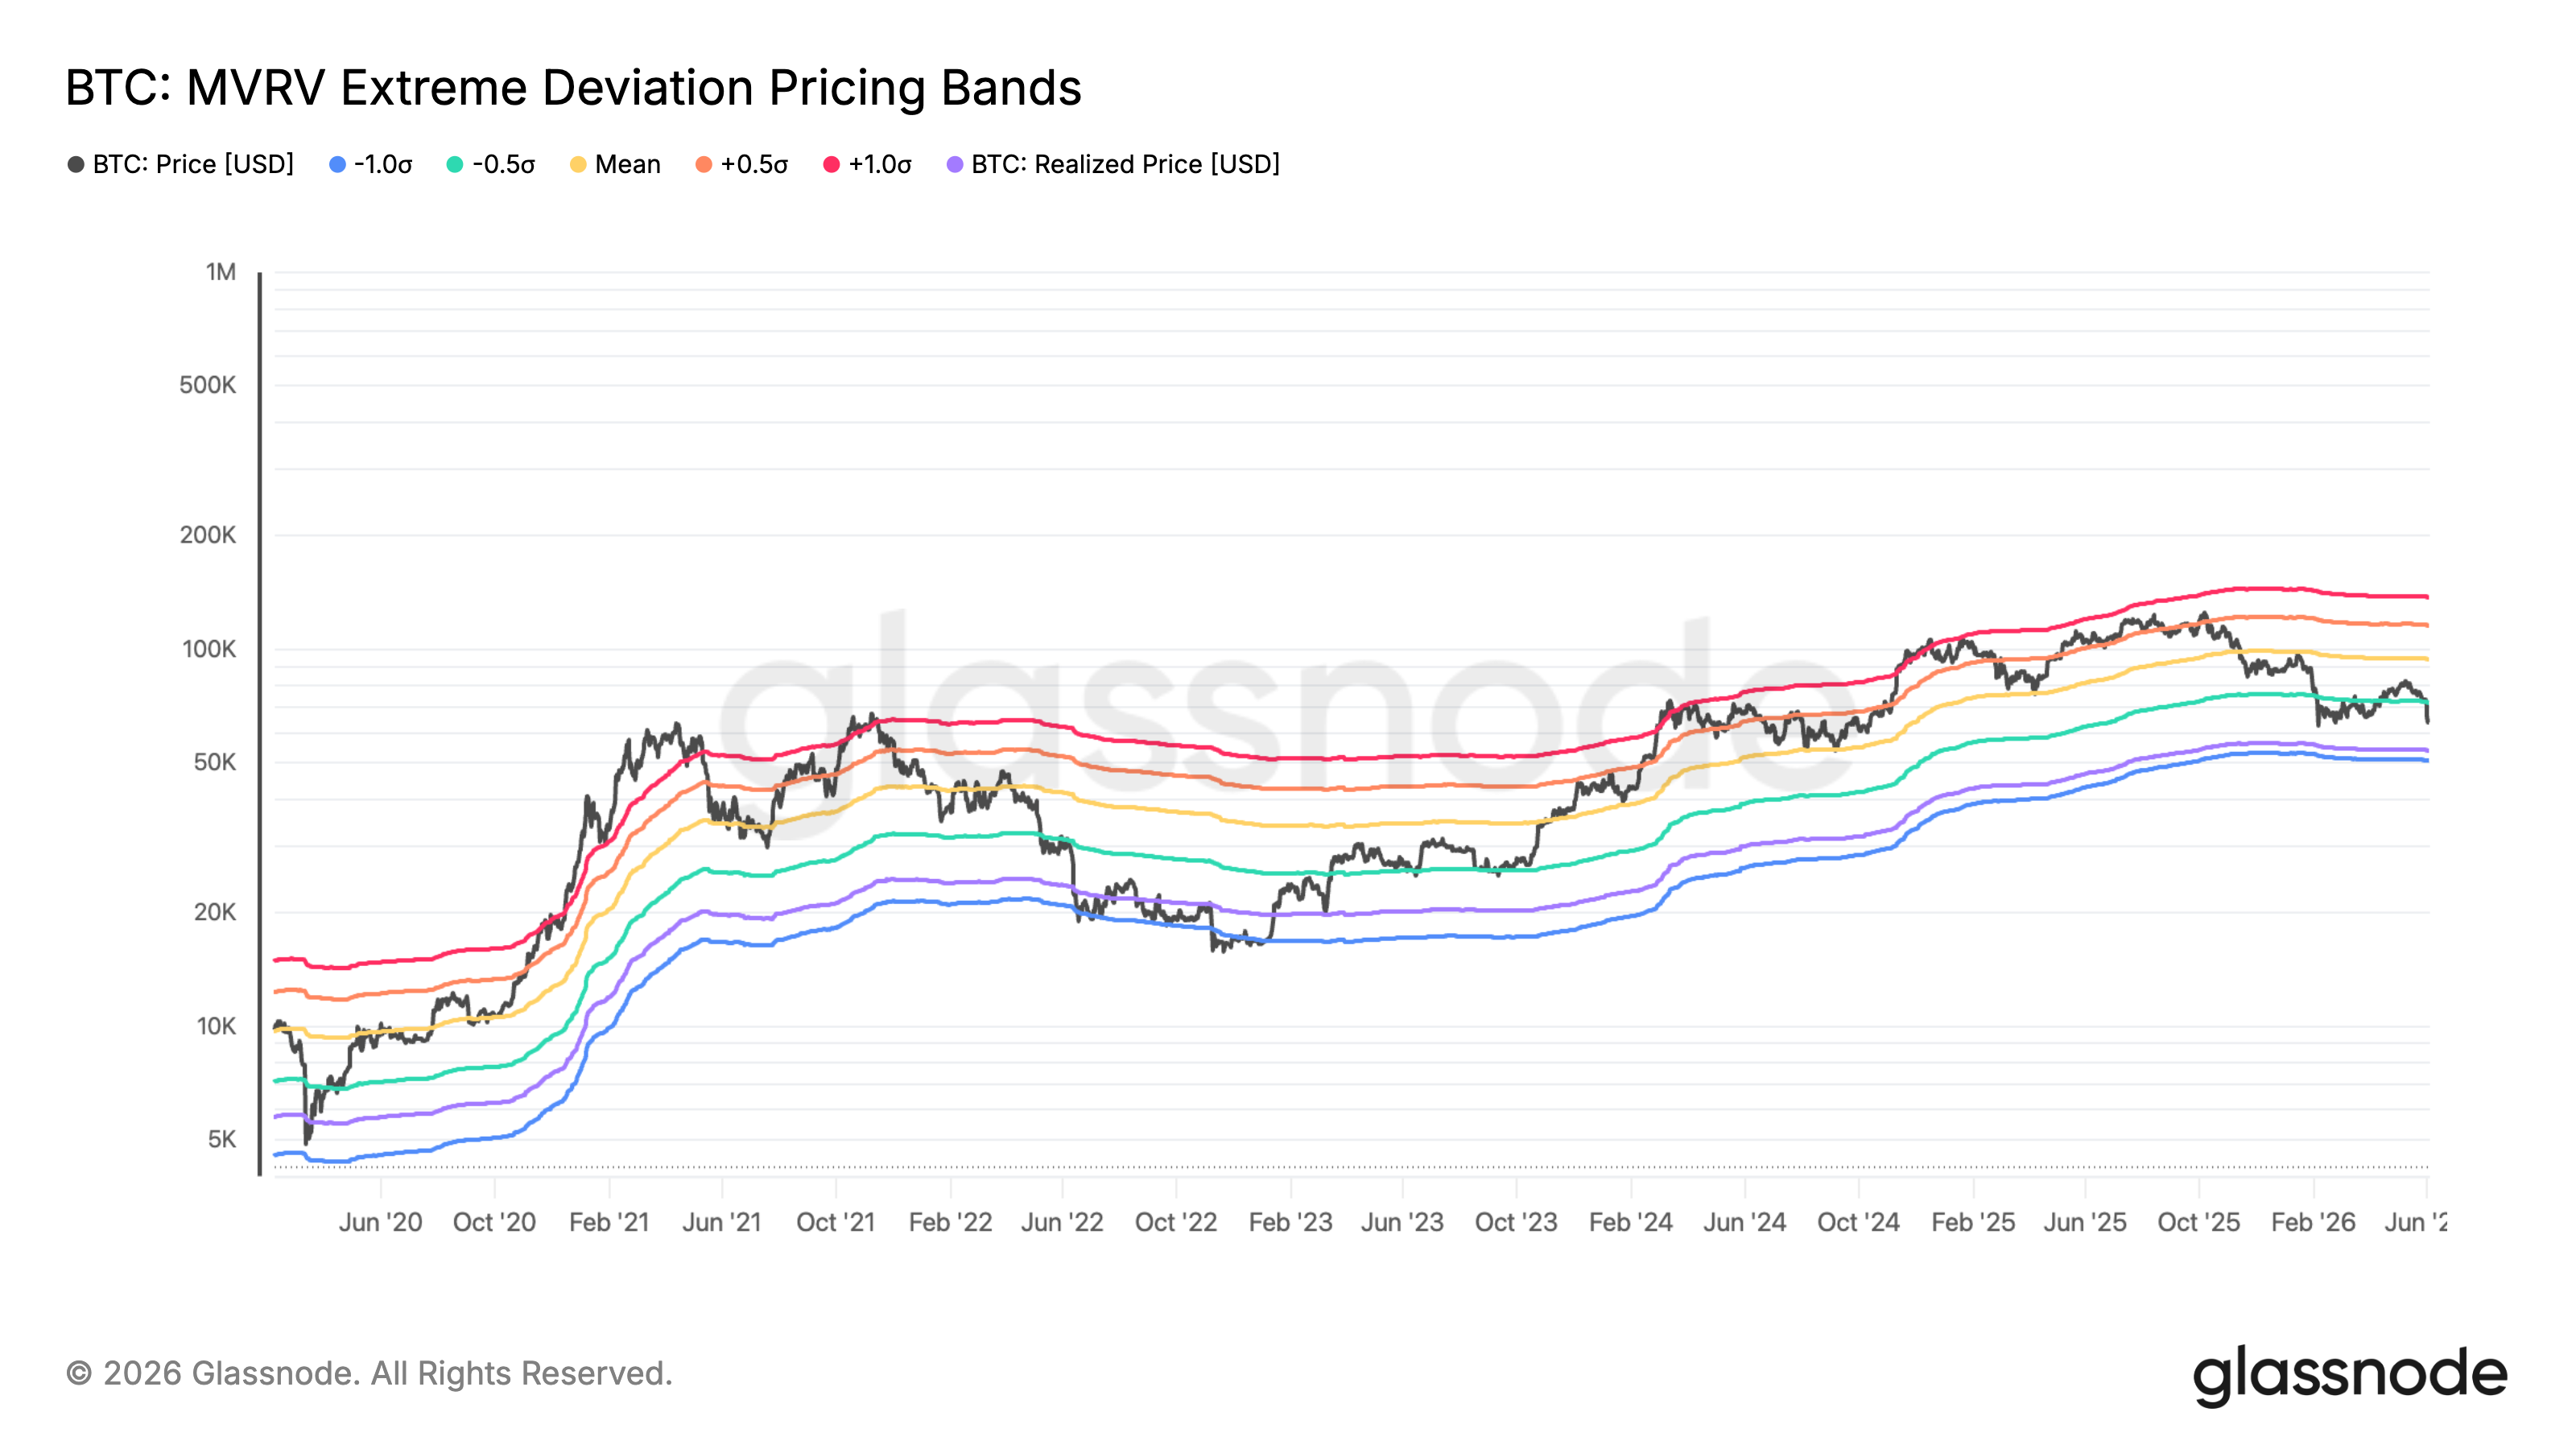
BTC MVRV extreme deviation pricing bands. Source: Glassnode
The same chart also shows another key support level (blue) near $50,560, where Bitcoin would look much cheaper based on onchain valuation.
Related: Bitcoin fell 21% after Strategy’s debt buyback news: Is Terra Luna-style doom loop next?
Together, these levels create a support zone between roughly $50,000 and $54,000. That lines up closely with the bear flag target near $50,000 to $51,000.
Bitcoin cup-and-handle breakdown risks drop toward $33,000
Bitcoin’s weekly chart is showing another bearish setup: a possible cup-and-handle breakdown.
The pattern shows BTC forming a rounded top, followed by a smaller rebound attempt inside the handle. Bitcoin price is now weakening near the lower end of that handle, close to the 200-week SMA and the $60,000 support level.
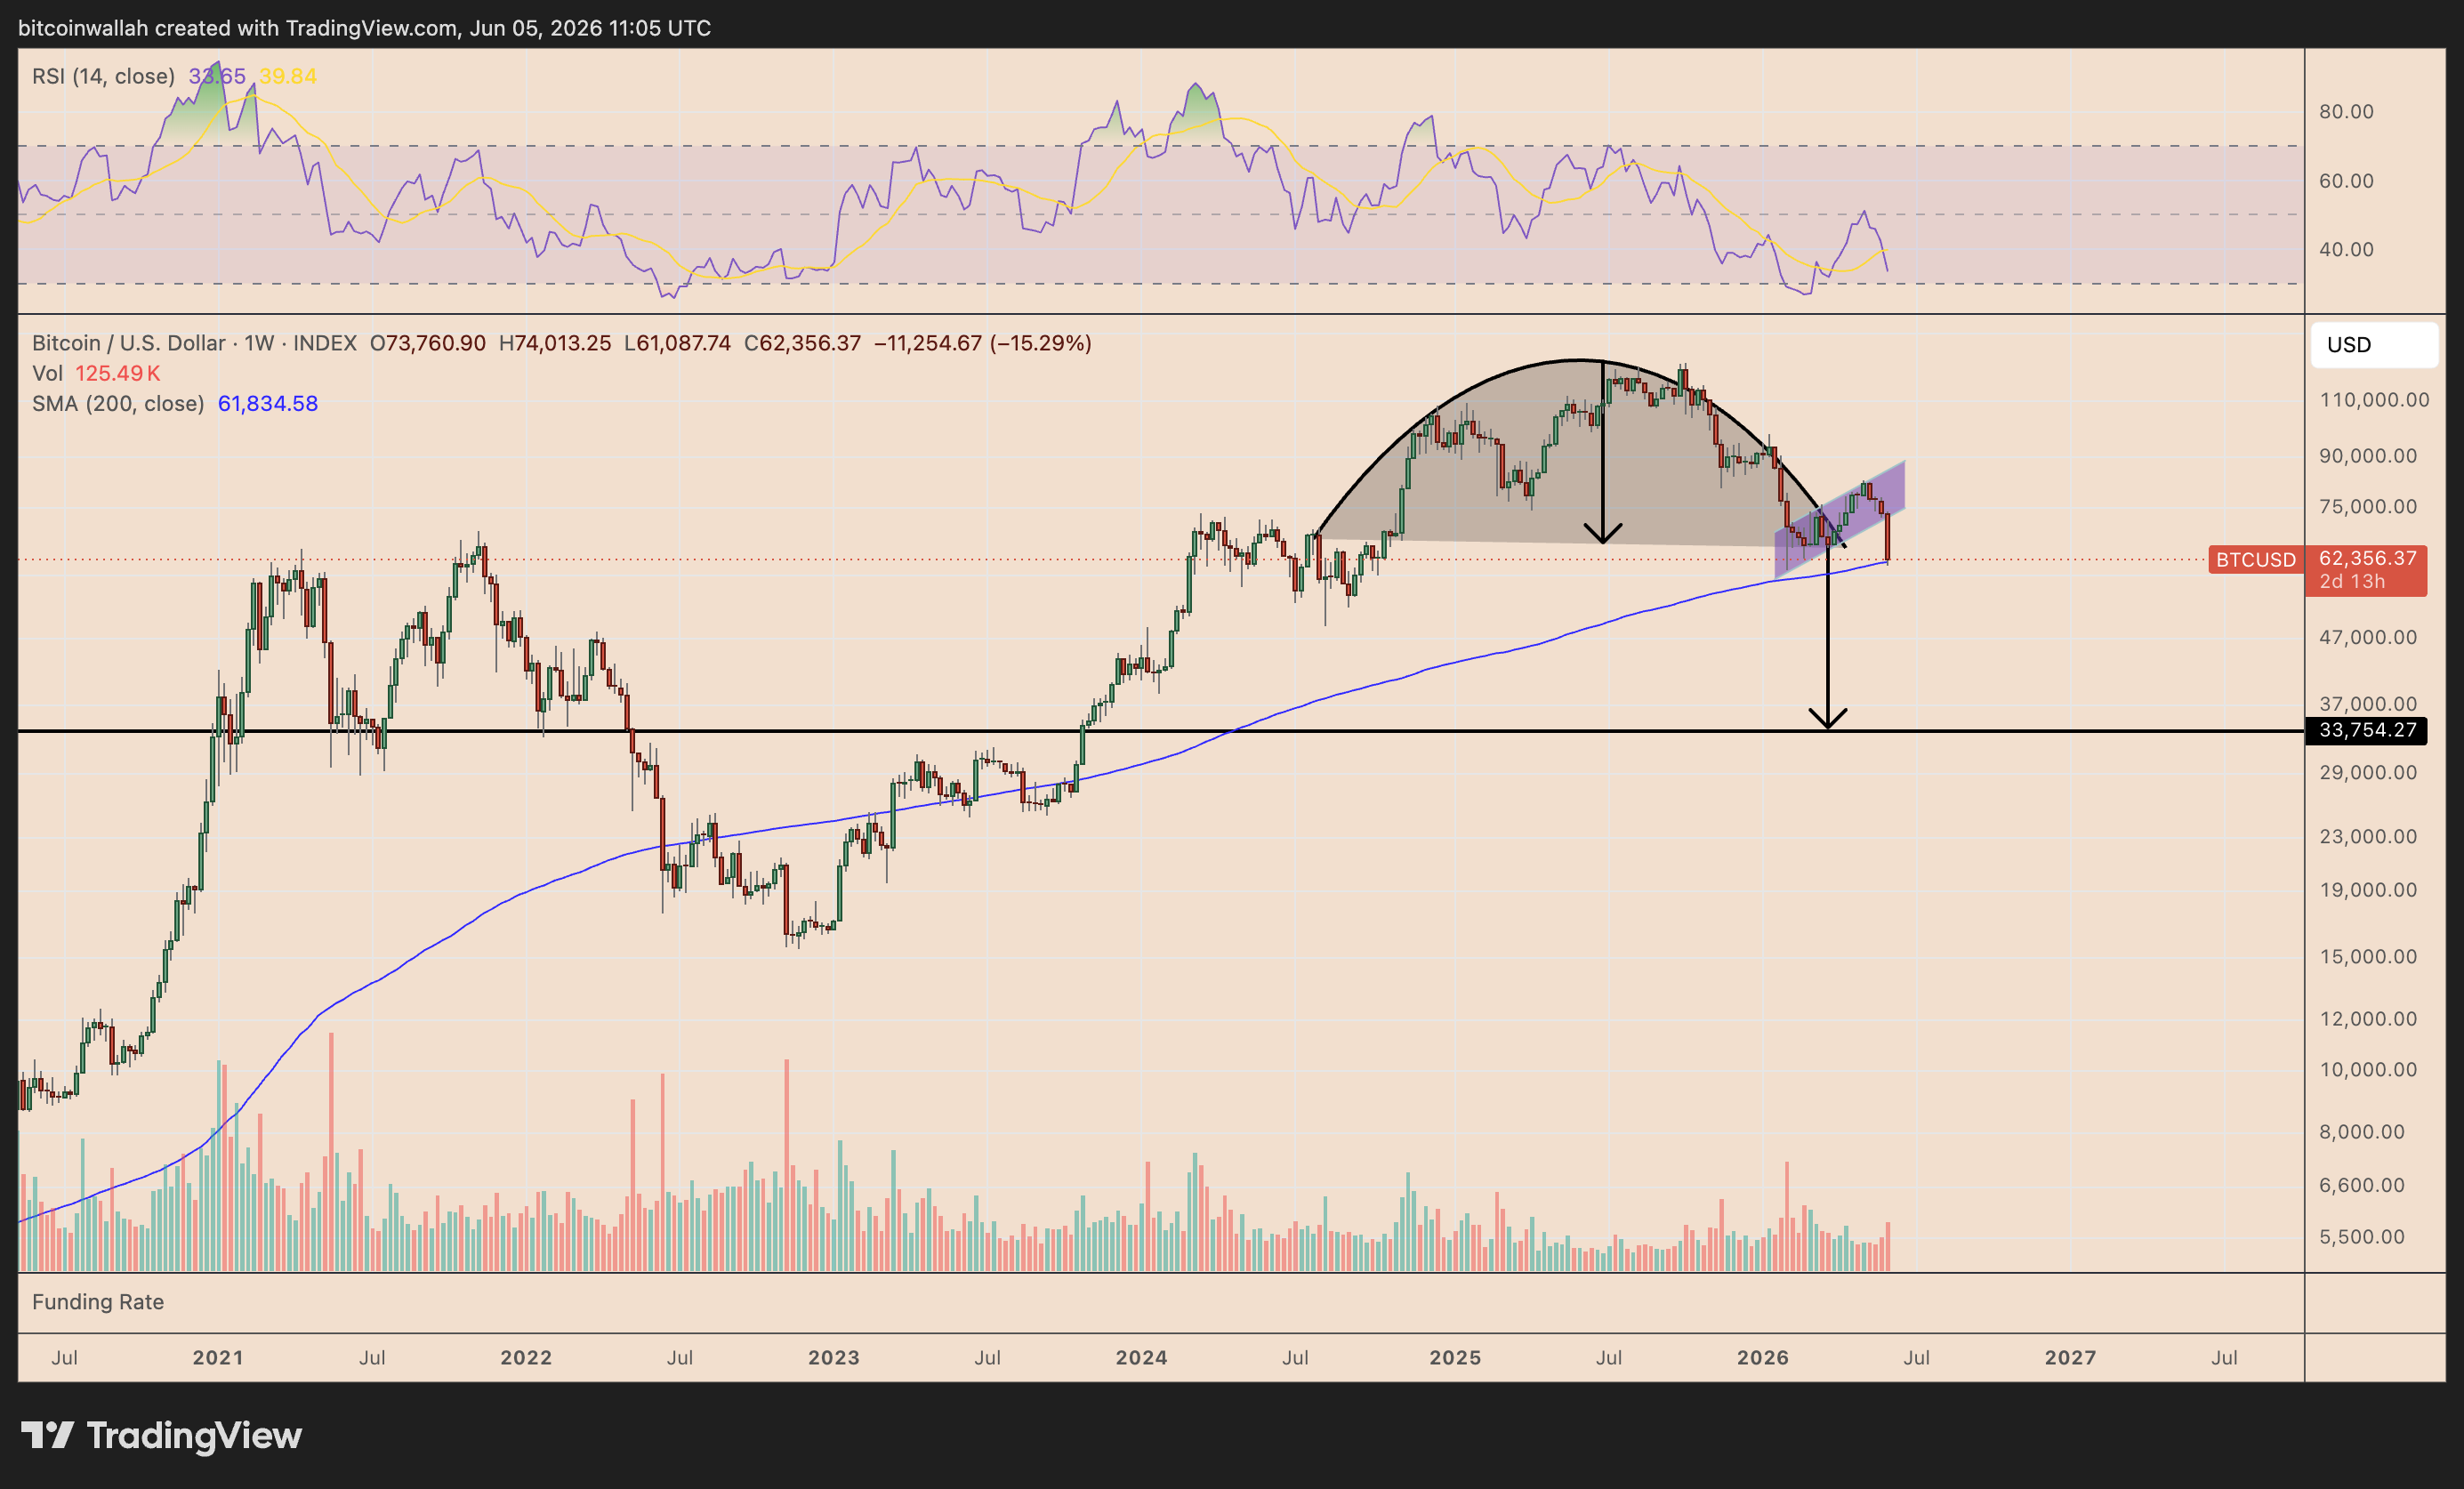
BTC/USD weekly chart. Source: TradingView
If Bitcoin breaks below this area decisively, the downside target from the pattern sits near $33,000.