




An early Ether (ETH) investor sold their ETH holdings over the past week as the price headed toward $2,000, sparking fears of further losses. However, onchain data tells a different story as traders speculate where ETH/USD might bottom.
Key takeaways:
- An early Ethereum whale sold $136 million in ETH, adding pressure as Ether trades below the $2,000 level.
- Onchain data shows no evidence that older ETH investors are selling en masse.
- Analysts warn the ETH price could fall further toward the $1,500 support.
Ethereum OG whale sells $136 million ETH
An old Ethereum whale, an early investor holding tokens since the network’s first years, sold 55,000 ETH worth about $112.25 million and 9,442 ETH worth roughly $24 million over the past week.
Related: Ether bears at risk of $2B squeeze as short positions build around $2K

The early Ether investor offloaded a combined $136 million at an average price of $2,041 per ETH, according to blockchain data tracker Lookonchain.
Selling by an old ETH wallet. Source: Lookonchain
However, this does not appear to be part of a wider trend, as an analysis of Ethereum’s supply, based on “HODL waves,” reveals that a significant portion of Ethereum supply remains unmoved on various time frames. In fact, the share of the supply by older holder cohorts has generally increased over the past year.
More recently, the 3m-6m investor cohort saw a notable reduction in supply, which has dropped to 9% from 13.5% on May 19. The 1w-1m holder cohort has also seen its supply holdings drop to 2.6% from 4.76% over the same period. This suggests that most of the supply changing hands is being done by short-term holders.
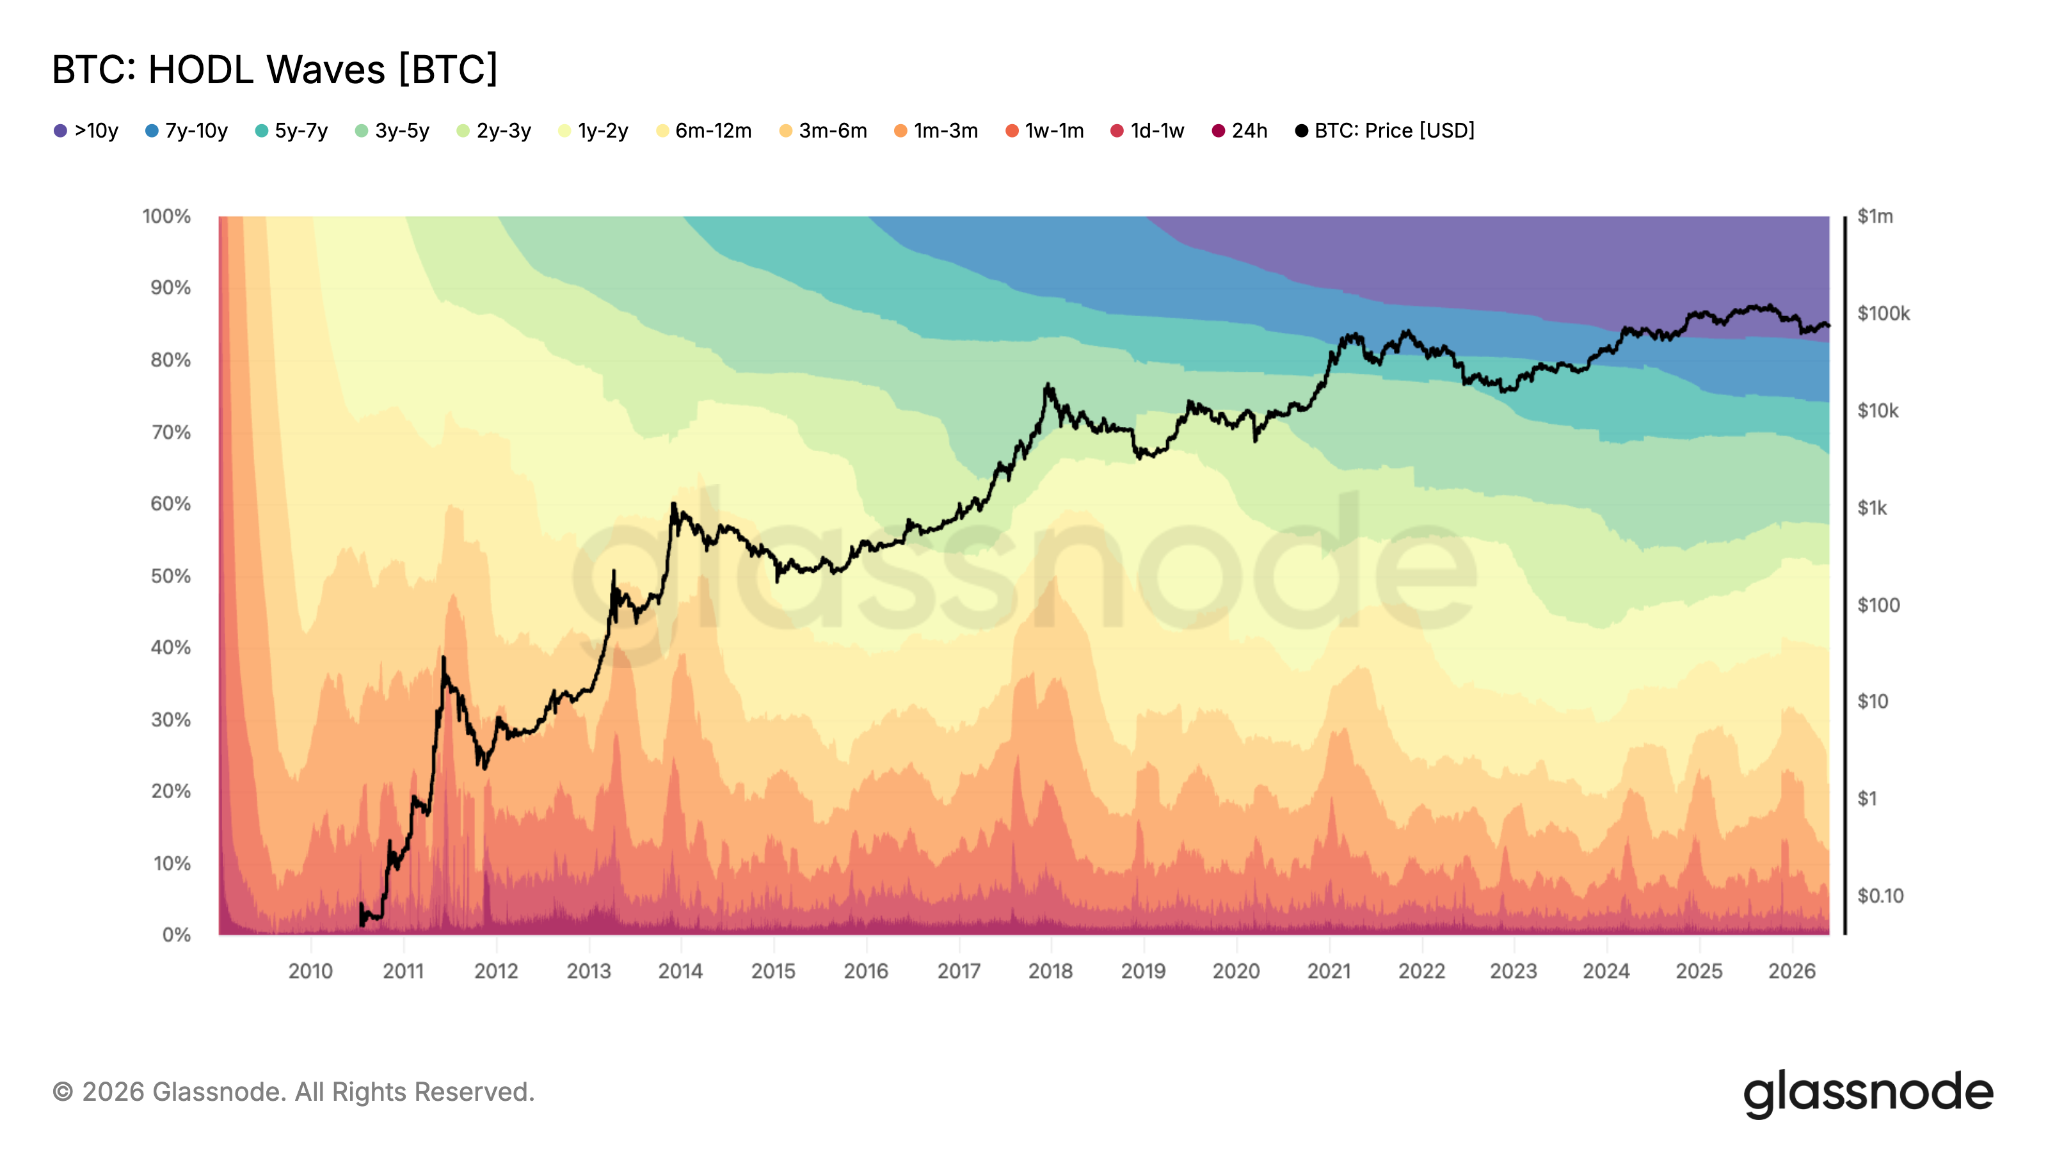
Ethereum: HODL Waves. Source: Glassnode
In fact, supply held by the 5y-7y investor cohort has increased slightly to 9% from 8.59% on May 19.
Moreover, the chart below shows that the supply last active 5-7 years ago has only seen a modest rise in recent weeks and is well below the activity seen in 2022 when ETH price bottomed below $1,000.
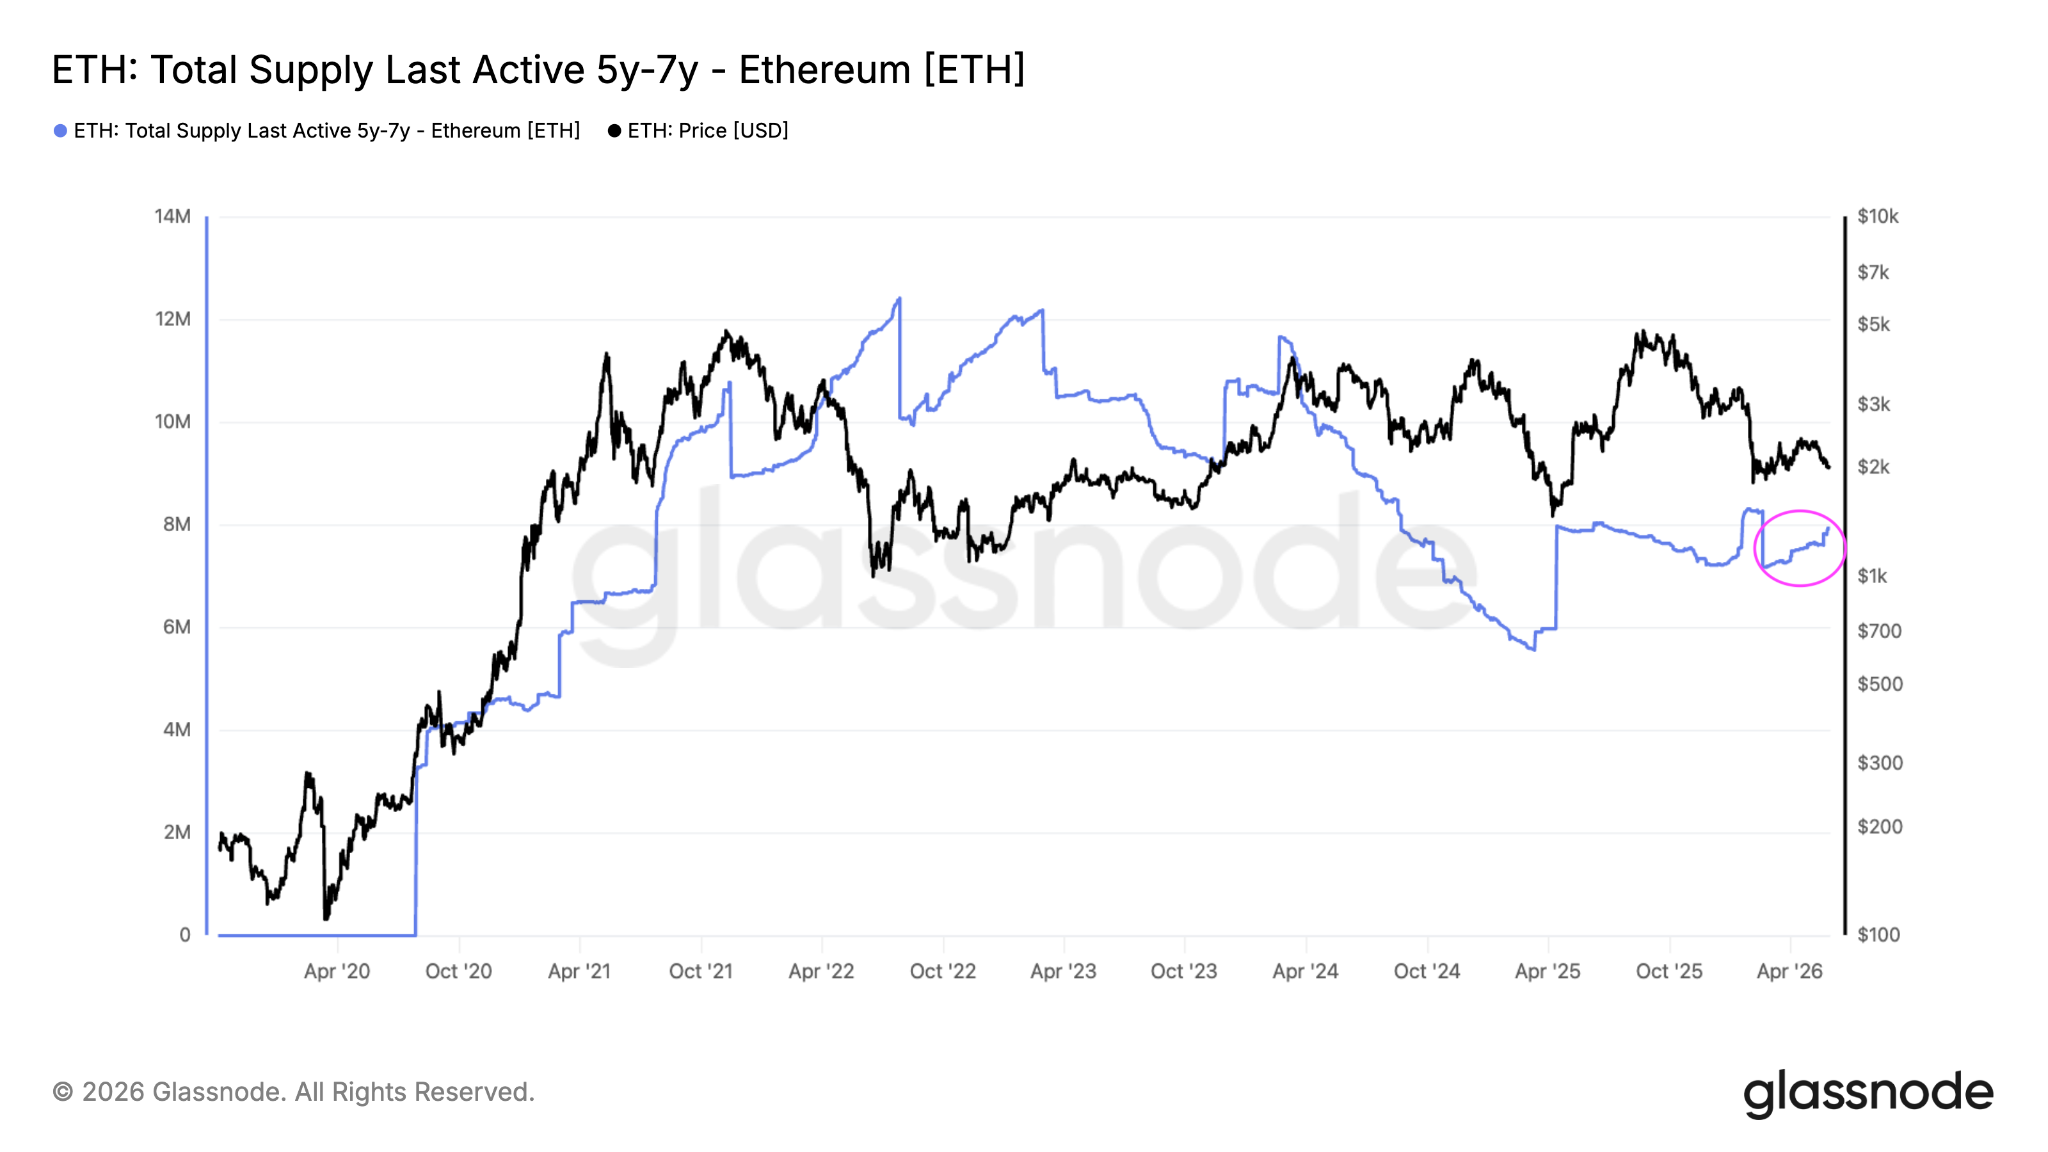
ETH: Total supply last active 5 years to 7 years. Source: Glassnode
Except for several significant players announcing that they have sold a part or their entire ETH holdings recently, there’s no real broad trend to support the argument that Ethereum OGs are selling en masse.
Ether price drop to $1,500?
Since Thursday, ETH/USD has been oscillating around the $2,000 psychological level as traders braced for more price downside.
At the time of writing, ETH is trading at $1,980, down 2% over the last 24 hours and 6.5% on the week.
“This doesn’t look good for Ethereum,” analyst Alex Marzell said in an X post on Sunday adding:
“Momentum continues to favor the bears as $ETH moves closer to the next key support area.”
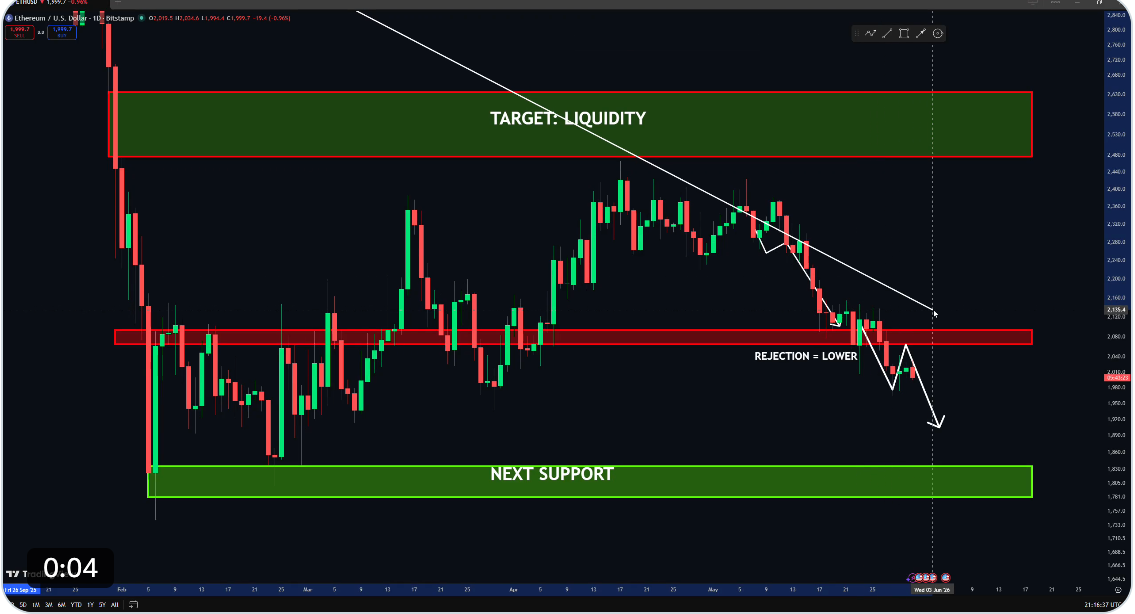
ETH/USD daily chart. Source: X/Marzell
Marzell was referring to the crucial support around $1,800, which analysts say must hold to avoid a deeper correction.
Fellow analyst Merlijn The Trader said that the ETH/USD price action is “mapping perfectly onto a Wyckoff Accumulation structure,” as shown on the three-day chart below.
The analyst explained that ETH is currently in a “Phase B consolidation, post-selling climax” and was entering Phase C, where it would bottom below $1,500.
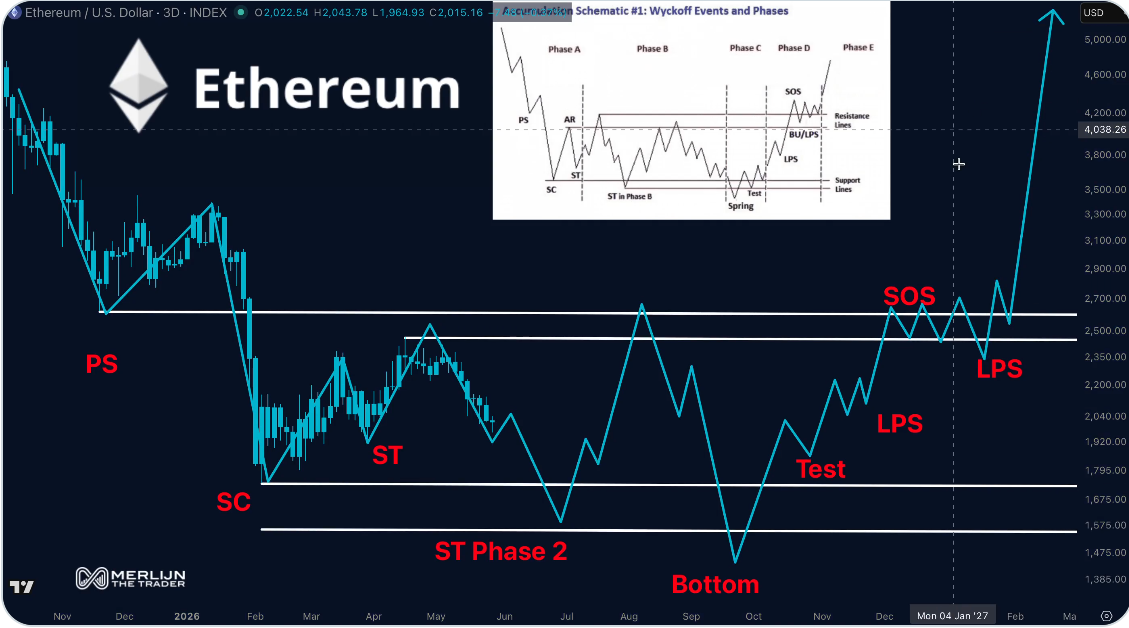
ETH/USD three-day chart. Source: Merlijn The Trader
Another analysis by Echo Analysis said a bear flag breakdown projected ETH price drop toward $1,500 support.
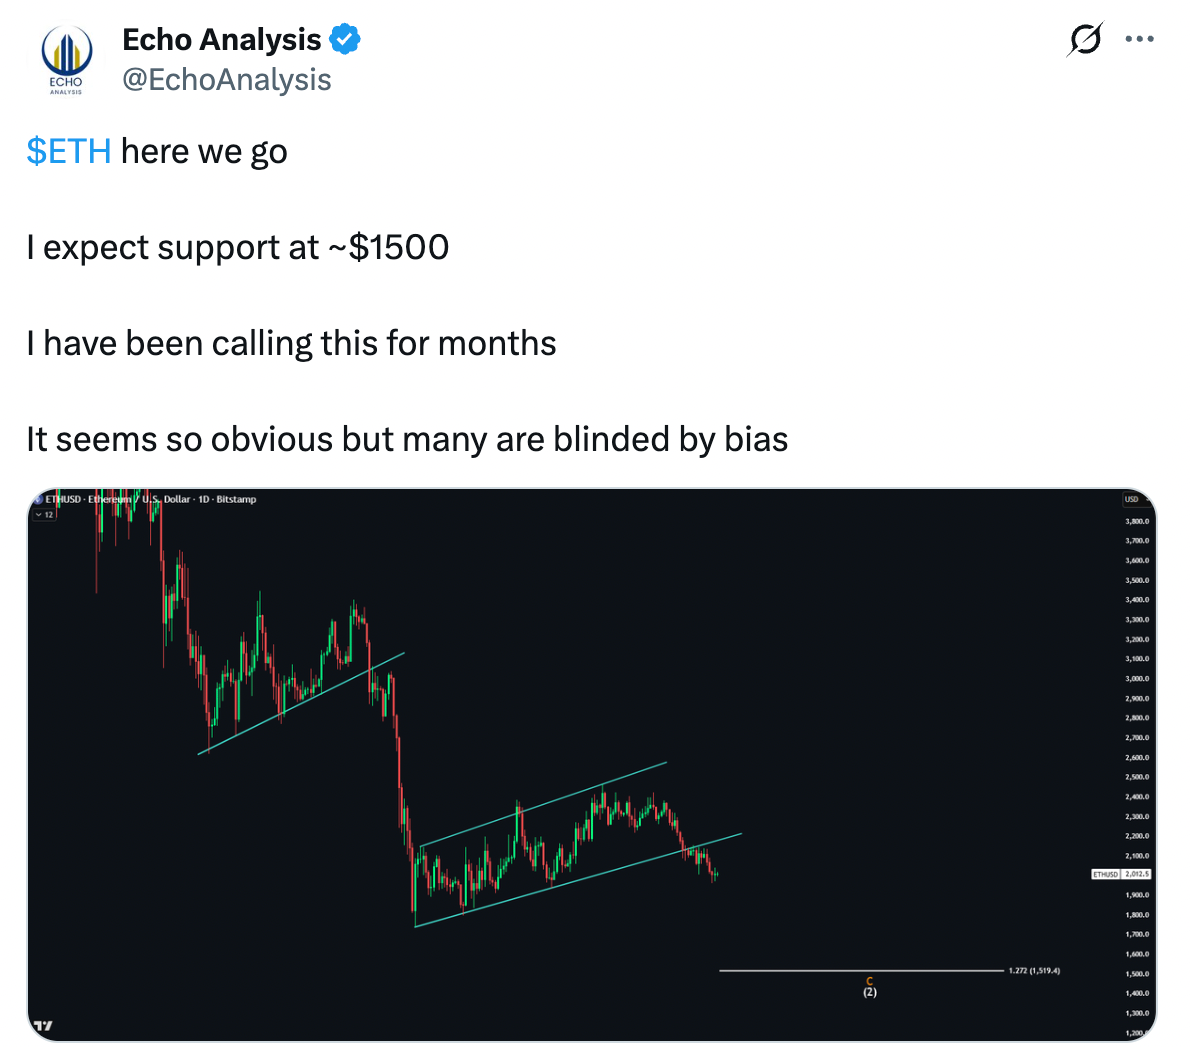
ETH/USD daily chart. Source: Echo Analysis
As Cointelegraph reported, increasing supply on exchanges and declining ETF demand put ETH at risk of another leg down toward the $1,500-$1,700 demand zone.